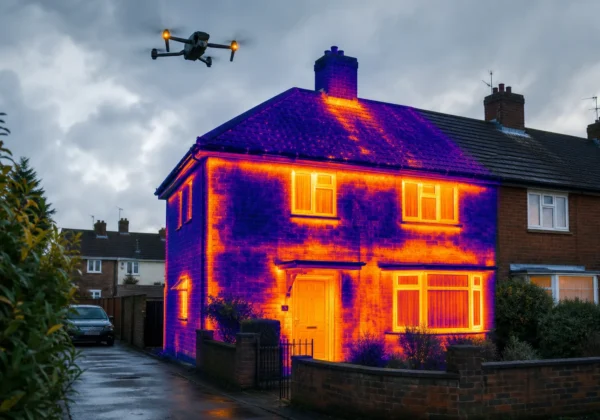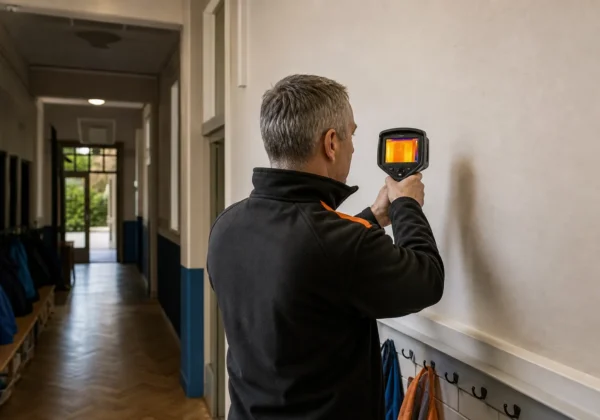
Solar panel thermal imaging lets you see hidden heat patterns that a visual walk‑around misses. It spots faulty cells, loose connections and shading problems before they cut output. Below we explain what the images tell you, how to read them correctly, the standards that keep the data trustworthy, and how you turn those clues into operational actions.
We analyzed 68 comments and questions from YouTube, Reddit and Quora about solar panel thermal imaging and found that 25% asked about the selection of thermal camera hardware.
What Solar Panel Thermal Imaging Can Reveal
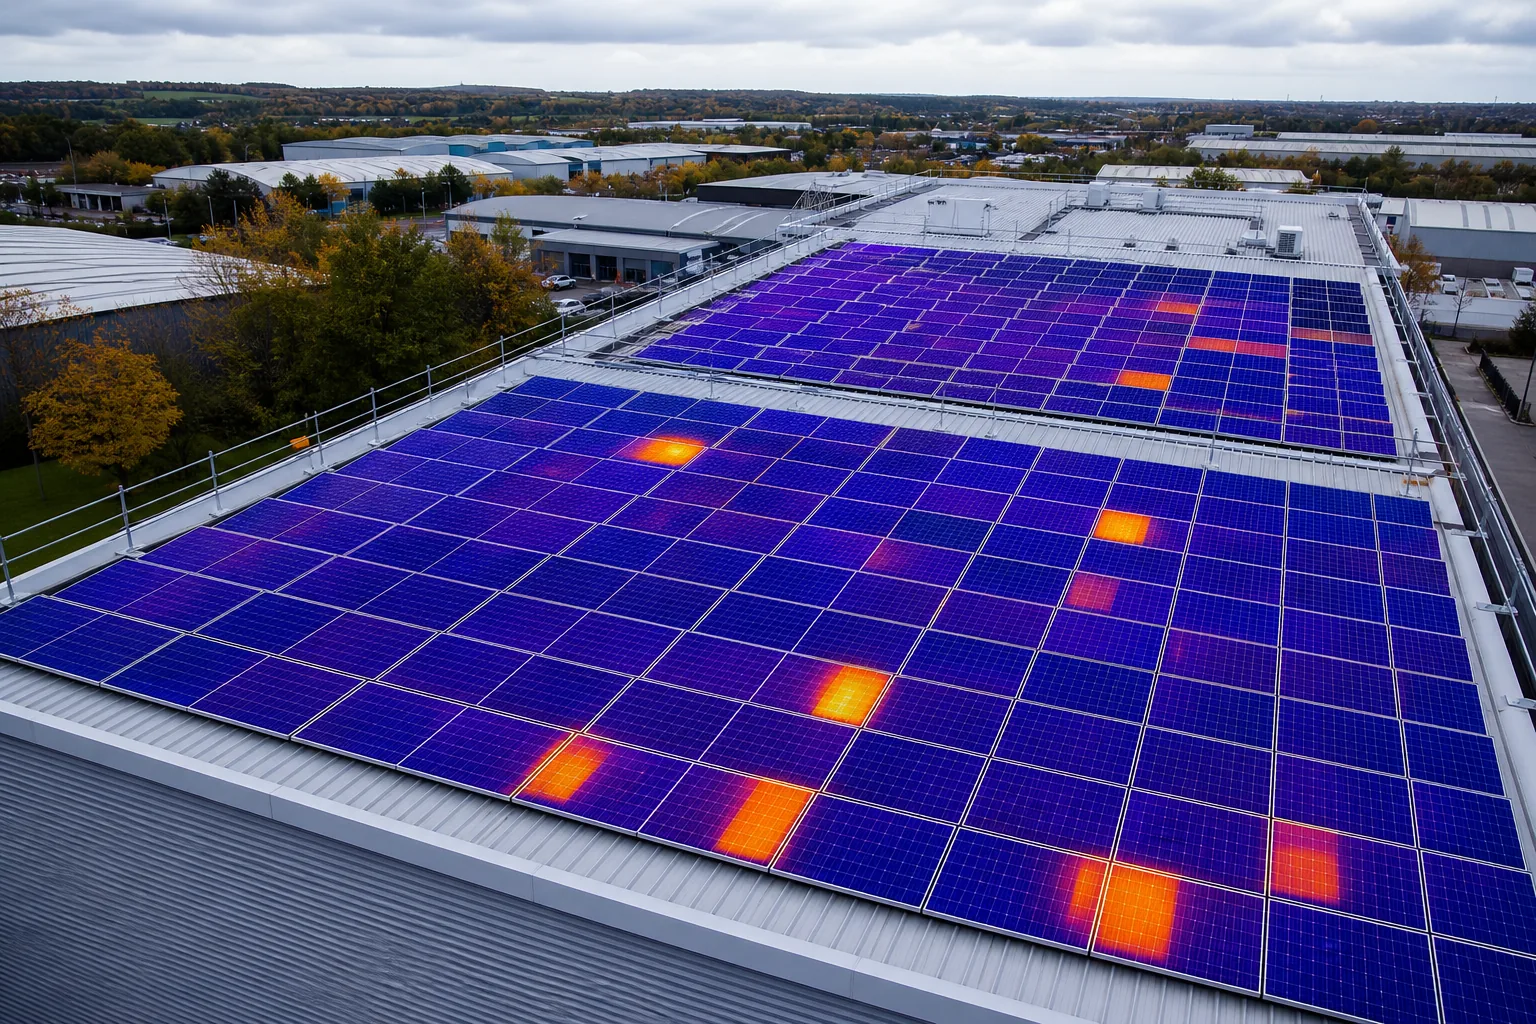
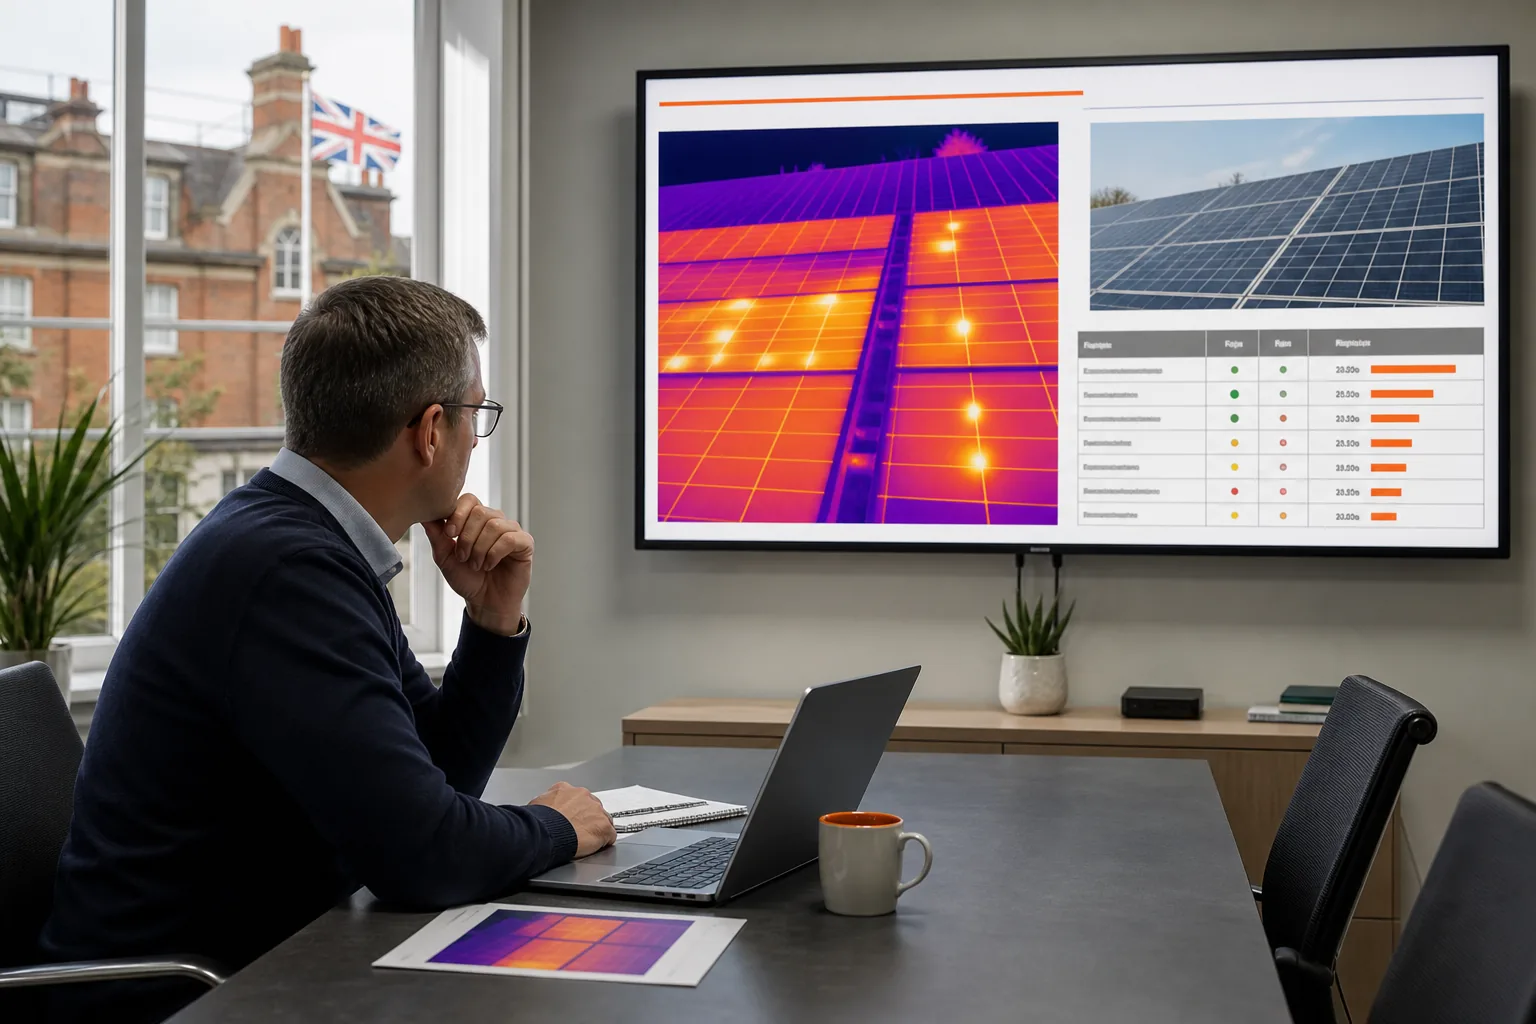
Thermal cameras capture infrared radiation and turn temperature differences into colour‑coded maps. A healthy PV module radiates heat uniformly; any hot spot stands out as a bright patch. Those bright patches can mean cracked cells, a failing bypass diode, or a loose electrical connection that is heating under load. The same image can also show shading from nearby objects or dirt that forces some cells to work harder, raising their temperature.
Because the camera records a radiometric temperature, you can compare one panel’s reading with its neighbours and calculate a ΔT value. A ΔT of 5 °C often points to a minor issue such as soiling, while a rise above 30 °C can signal a fire‑risk hot spot that needs immediate attention. The data also helps you map which strings are under‑performing, so you can target inspections rather than replace whole arrays.
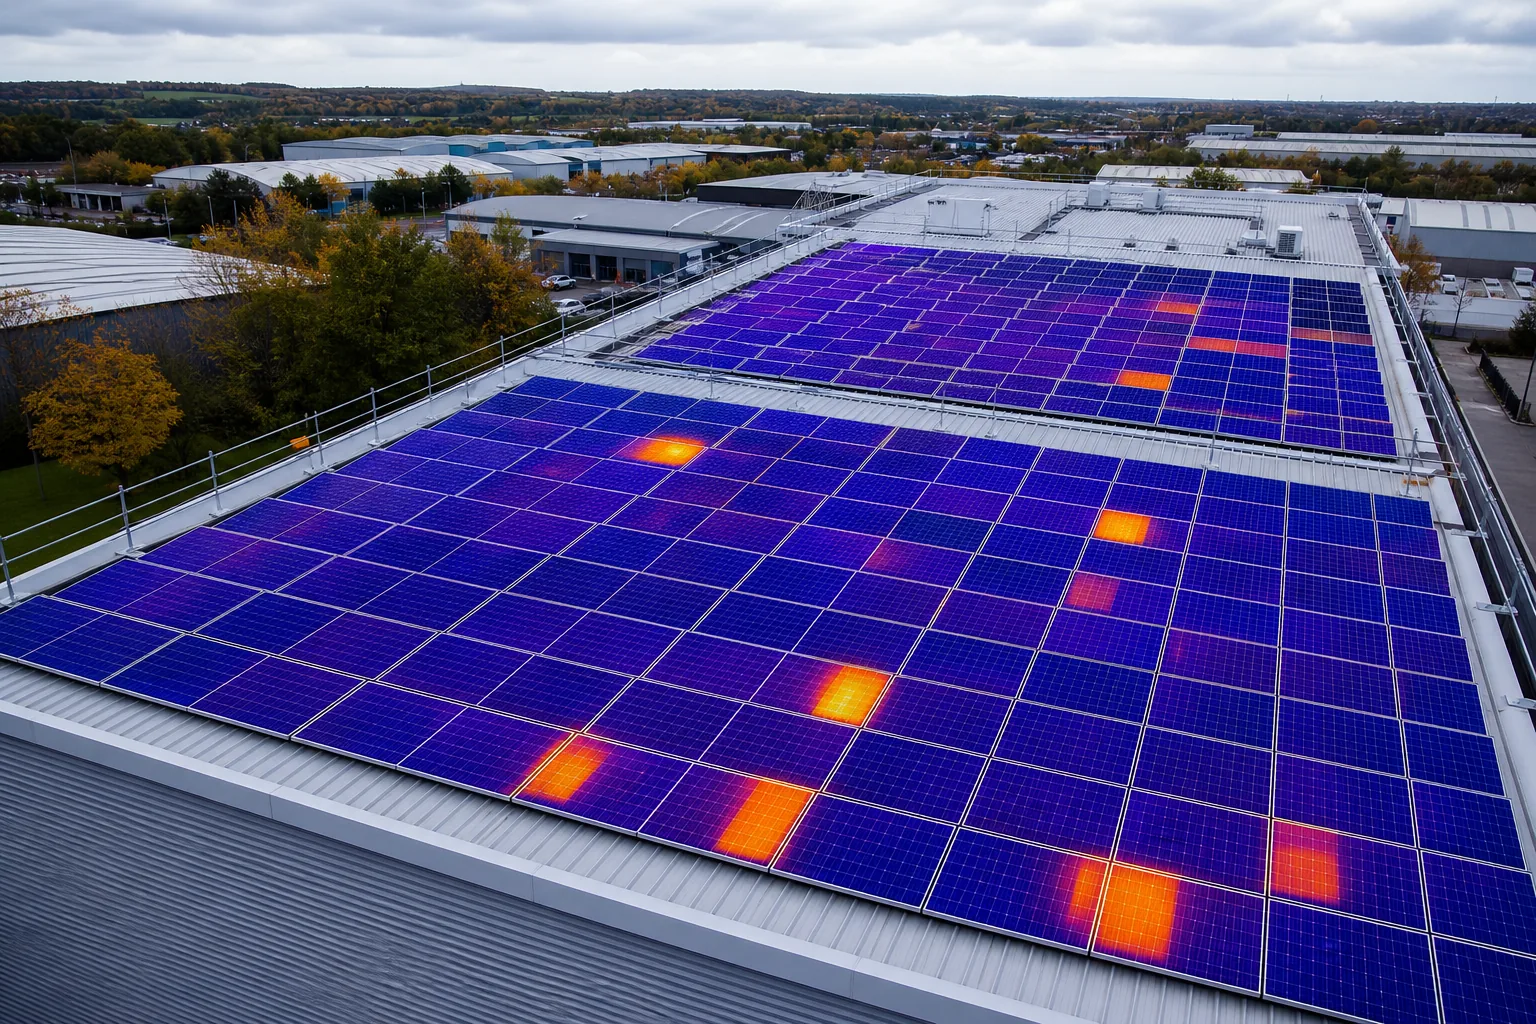
When you pair the thermal map with a 3‑D model of the roof, you get a clear picture of where heat is escaping, where moisture may be trapped and which panels are under‑performing. This is the level of detail Visual Perspectives provides in its reports: precise evidence of what the naked eye can’t see.
Our team follows a fully IEC 62446‑compliant workflow, logging irradiance, wind speed and camera settings for every flight. That audit trail lets you prove to insurers or warranty providers that the inspection meets the industry’s accepted benchmark.
For a step‑by‑step look at how we plan and execute a drone‑based survey, see our guide on How to Conduct an Aerial Solar Panel Inspection. You’ll see how the flight plan, data capture and post‑processing fit together.
How to Interpret Thermal Anomalies and Their Limitations
Infrared cameras detect heat and create a visual map that shows where something is hotter than its surroundings. The map alone is only an observation; the real value comes from adding context: panel layout, electrical strings and operating conditions.
Typical anomalies include:
- Bright, isolated spots, often a cracked cell or a high‑resistance joint.
- Warm bands across a whole section, usually a bypass‑diode failure.
- Uniformly warmer strings, often a string that is disconnected or not delivering power to the inverter.
Interpreting these patterns requires a baseline image taken at commissioning. By comparing new scans to that baseline you can spot gradual degradation that wouldn’t trigger an alarm on a single visit.
Not every hot spot is a defect. Reflections from glass, recent rain or clouds can create false positives. The best practice is to rescan any suspect area under clear‑sky, peak‑sun conditions and confirm the temperature rise persists.
When an anomaly is confirmed, the next step is electrical testing to verify voltage and current loss. Only then can you classify the fault’s severity and plan remedial work.
Inspection Conditions, Equipment and IEC 62446-3
IEC 62446‑3 sets the technical specification for outdoor infrared thermography of photovoltaic systems. The standard sets minimum requirements for camera resolution, thermal sensitivity and the number of pixels covering each cell, and those requirements decide the flight altitude for a given camera sensor.
Typical equipment includes a radiometric thermal camera mounted on a CAA‑authorised drone. The camera is calibrated before each flight, with emissivity set to 0.85 to 0.90 for clean glass‑covered PV cells. Conditions must also meet the standard, including irradiance of at least 600 W/m² on the module plane, limited wind and cloud cover, and dry module surfaces.
Our process captures the full suite of metadata required by IEC 62446‑3: ambient temperature, solar irradiance, wind speed, camera settings and GPS‑tagged panel IDs. This data is embedded in each thermogram so the report can be audited later.
For a worked example of a commercial‑roof inspection that follows these rules, read our How to Conduct a Commercial Solar Panel Inspection guide.
Beyond the camera, we use software that stitches thousands of frames into an orthomosaic, then runs an algorithm that flags any pixel exceeding the hotspot threshold (typically 2 to 3 °C above the panel average). The analyst reviews each flag to confirm it isn’t a reflection or a soiling artefact.
All findings are compiled into a report aligned with IEC 62446-3, listing each anomaly with its location, the measured ΔT, a severity classification and recommended remedial action.
Turning Findings into Maintenance and Estate Decisions
Once you have a list of thermal anomalies, the next step is to translate them into a maintenance plan that fits your estate’s budget and risk appetite. High‑severity hot spots (ΔT > 30 °C) should be treated as urgent repairs. They pose a fire risk and can cause irreversible cell damage. Medium‑severity issues (ΔT 10‑30 °C) are usually scheduled for the next planned service window, while low‑severity signs (ΔT < 10 °C) often just need cleaning or monitoring.
For public‑sector estates, the data also supports funding applications. Public sector funding applications, including PSDS Phase 4, generally need sound evidence about the condition of the buildings and assets involved. An IEC 62446-3 thermography report can form part of that evidence when PV is in scope.
Ranking defects by severity and likely energy loss lets asset managers prioritise the work that matters most, a key concern for local authorities and NHS trusts with tight capital budgets.
When a defect is linked to a specific component, for instance a faulty electrical connection in a combiner box, we recommend a targeted electrical test before any physical repair. This avoids unnecessary panel removal and keeps downtime low.
Finally, the report is archived with full metadata, creating a baseline for future trend analysis. Over time you can spot patterns, such as a rise in hot‑spot frequency on a particular string, which may indicate a systemic issue like corrosion.
A follow-up scan after repairs confirms whether the anomaly has been resolved and gives you evidence that the corrective work was effective.
For a broader view of what a solar‑panel inspection service includes, see Best Solar Panel Thermal Imaging Inspection Services 2026. It outlines the full deliverable package, from flight planning to final report.
Frequently Asked Questions
What temperature difference indicates a hotspot?
A hotspot is generally defined by a ΔT of 5 °C or more above the surrounding panels, but a ΔT above 30 °C is considered critical and requires immediate action.
Do I need to shut down the array for a thermal scan?
No, the inspection is performed while the system is operating under normal load, because the heat generated by the panels is what the camera measures.
How often should a commercial rooftop be thermographically inspected?
Many owners scan annually, and again after severe weather or repeated faults. Your O&M contract, insurer or warranty terms may set a specific interval.
Can thermal imaging detect cracked cells that don’t heat up yet?
Thermal imaging only shows temperature anomalies, so a crack that hasn’t caused resistance won’t appear. Electrical testing or EL imaging is needed to find such latent defects.
Is the IEC 62446 report accepted by insurers?
Many insurers, warranty providers and O&M contracts refer to IEC 62446-3 thermography, so a compliant report is useful evidence. Check your own policy and warranty terms for what they require.
Conclusion
Solar panel thermal imaging gives you a clear, data‑driven view of hidden defects and performance loss. We recommend scheduling an IEC 62446‑compliant drone survey now, then using the report to prioritise repairs and support any funding applications.