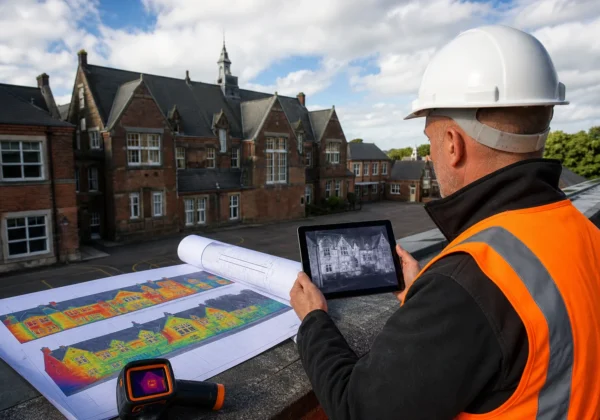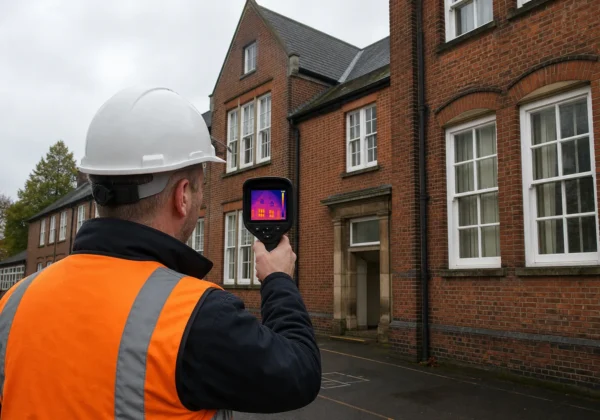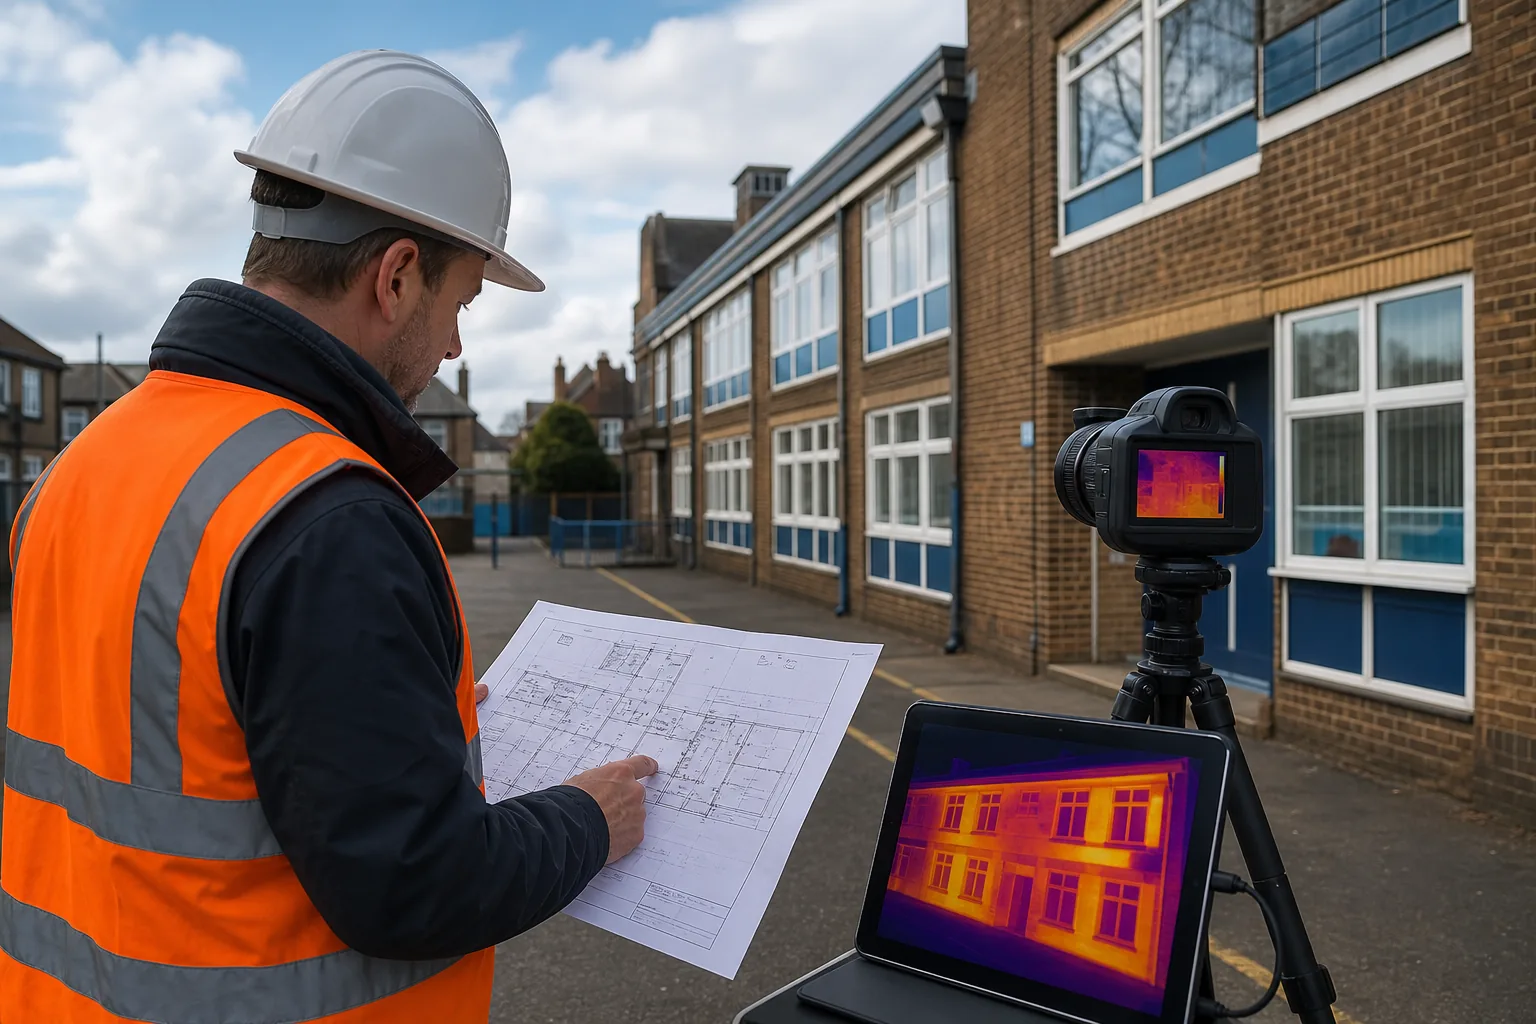
Thermal imaging can show heat loss, cold bridging and moisture patterns that a visual survey misses. But a warm or cool patch is only a clue, not a diagnosis. This building envelope thermography guide sets out a repeatable method for UK estates, schools, NHS buildings and commercial property teams.
Step 1: Define the Inspection Objective and Building Scope
Start by writing down what the building envelope thermography survey must prove. A clear question leads to useful images. A vague request usually produces a long report with little help for the next budget meeting.
Your objective might be to find heat loss before a retrofit project. It might be to check suspected failed cavity insulation, investigate damp marks or review a roof after repeated leaks. You may also need evidence for a condition survey or a decarbonisation plan.
Set the scope before anyone arrives on site. Record the buildings, elevations, roof areas and internal zones to inspect. Note the construction type where known. Brick walls, rendered walls, curtain walling and insulated panels each produce different thermal patterns.
Gather drawings, past repair records and energy bills if they are available. Mark known complaints on a plan. A room that feels cold beside a stairwell needs a different review from a whole school wing with high heat demand.
We also ask who will use the result. A facilities manager may need repair locations. A retrofit coordinator may need evidence for a fabric-first plan. A surveyor may need image references that match a defect schedule.
The Building Defect Thermography service from Visual Perspectives Limited can combine envelope heat-loss assessment with building condition evidence. That matters when thermal findings will guide intrusive checks or planned works.
For technical projects, define the required output too. Ask for location references, paired visual images, thermal images and a clear statement of limitations. If drone access is needed, include roof plans and safe launch areas in the brief.
Building-integrated systems interact with the building fabric, so inspect the interface between systems and the envelope rather than viewing each item in isolation. Relevant technical material may also help frame that interface.
By now you should have a written purpose, a marked-up scope and an agreed report format. That small piece of planning prevents missed elevations and stops the survey becoming a hunt for interesting colours on a screen.
Step 2: Prepare the Site and Check Thermal Survey Conditions
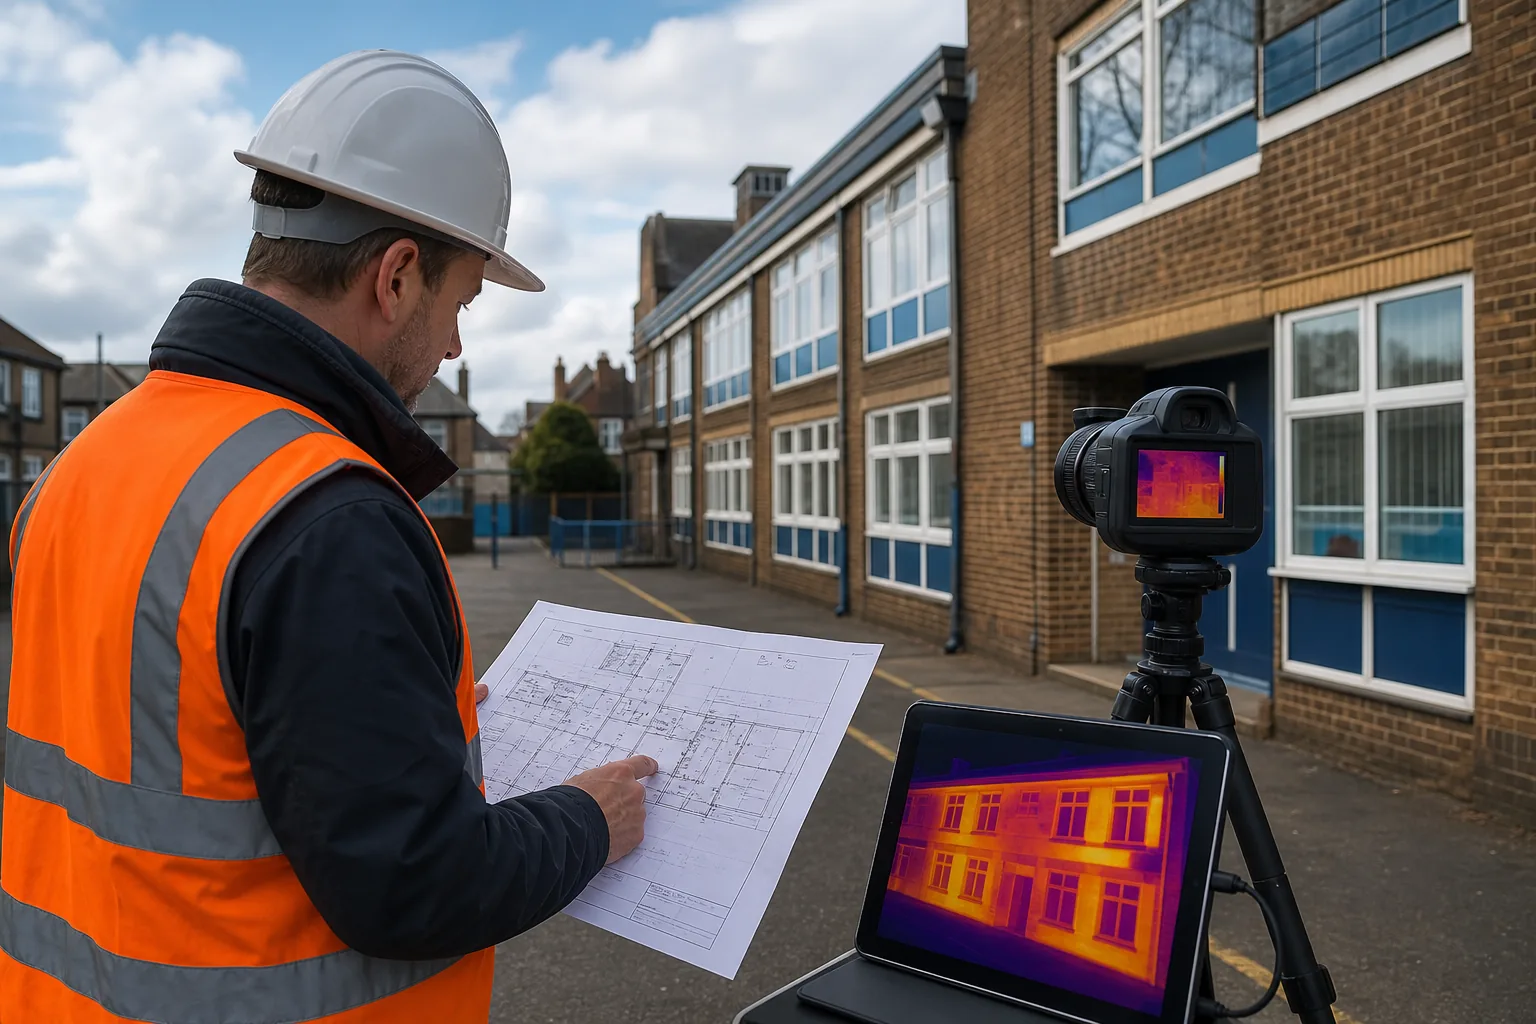
Good building envelope thermography depends on the conditions at the time of capture. Thermal cameras measure surface temperature differences. They don’t see insulation quality directly.
Arrange the survey when the building has a useful temperature difference between inside and outside. Heating schedules matter. If a school is empty and unheated, internal wall defects may not stand out. If doors are open all day, draughts may dominate the image.
Ask the site team to keep normal heating running before the inspection. Agree a period for access and avoid major changes during the survey. Record the heating state in the field notes. This detail can explain an unusual result months later.
Check the weather before travel. Rain can cool surfaces and hide the pattern you need. Strong sun can heat one elevation while leaving another in shade. Wind can alter surface temperatures around openings and roof edges.
For external work, note the direction of each elevation. A south-facing wall may carry stored solar heat after sunset. An east-facing façade may behave differently early in the day. Capture conditions need to be recorded, not guessed from the image.
Prepare the site in three parts:
- Confirm access permissions and any safeguarding controls.
- Clear items that block walls, windows or roof edges.
- Mark plant rooms, kitchens and other spaces with unusual heat loads.
Inspect reflective materials with care. Glass and polished metal can reflect the sky, people or nearby equipment. That reflected energy can look like a temperature reading from the surface itself.
Set the camera for the job and check focus before collecting evidence. A blurred image can make a small cold bridge look wider than it is. Keep the same approach across comparable areas, following building envelope thermal imaging best practices, so the report can compare like with like.
We plan drone work separately from ground thermography. A roof survey needs a safe launch point, airspace review and clear information about people below. A drone can reduce work at height, but it doesn’t remove the need for a proper site risk assessment.
When access is limited, use the site walk to find the best vantage points. A gap between buildings may hide a façade from ground level. A drone roof survey can capture that area, while an internal survey may explain the heat pattern from below.
By now you should have a site plan, a conditions log and an access plan. If the weather or heating state is unsuitable, postpone the work. A neat report built on poor conditions is still poor evidence.
Step 3: Capture Thermal Images Alongside Visual and Building Data
Capture each thermal image with enough context for someone else to find the same place. A close-up patch of colour is rarely useful on its own. Pair it with a standard photograph and a location reference.
Work in a set route. Move around each elevation in a consistent direction, then inspect key internal rooms. Give every area a code that matches the floor plan. Use the same code on the visual photograph, thermal image and written note.
For each notable image, record:
- Building and room or elevation.
- Direction of view and approximate height.
- Time of capture and weather conditions.
- Surface type and nearby heat sources.
- Reason the image needs further review.
Look for patterns rather than isolated colours. A vertical cool strip beside a window may point to a junction or missing insulation. A broad cool area near a roof edge may reflect air movement, damp material or a change in construction.
Use visual inspection to test the first idea. Check sealant joints, cracks, staining, vents and window frames. Thermal data becomes stronger when it matches a visible defect or a known construction detail.
For roofs, keep the survey question in view. A roof thermal survey may seek wet insulation, gaps in coverage or heat loss at a junction. Water can change the heat response of a roof, but the camera alone cannot confirm the depth or source of moisture.
For walls, compare similar bays where possible. One unusual panel is worth checking against adjacent panels. A whole elevation with the same pattern may point to design or construction, while one isolated patch may reflect a local repair.
Don’t change the camera palette to make a weak finding look dramatic. The palette helps the eye. It doesn’t improve the measurement. Keep the scale and settings clear in the record so another reviewer can understand what the colours mean.
Visual Perspectives Limited uses managed drone inspections where roof access or height makes a close survey difficult. Its service combines high-resolution thermal imaging with high-resolution 3D mapping, which can place a roof anomaly against a clear model of the asset.
That combination is useful when a maintenance team needs to find a defect quickly. A report that says “north roof area” may be too broad for a repair quote. A mapped location with a visual reference gives the contractor a better starting point.
By now you should have linked thermal images, visual images and notes for every surveyed area. You should also know which findings need closer inspection before anyone assigns a repair cause.
Step 4: Interpret Thermal Anomalies Without Overstating the Evidence
Interpreting thermal images is the hardest part of a building envelope thermography survey. A thermal anomaly is a difference from its surroundings. It is not proof of one specific defect.
Start with the pattern. Ask whether it is:
- Local or spread across a wider area.
- Aligned with a junction, opening or service.
- Repeated on similar parts of the building.
- Supported by a visible sign or site record.
- Stable under the recorded survey conditions.
Cold bridging occurs where heat passes through a part of the envelope more easily than nearby areas. Common locations include slab edges, window reveals and wall-to-roof junctions. The image may show the effect, but the building detail explains why it occurs.
Air leakage can produce narrow, irregular cool lines around doors, windows and service penetrations. Yet a similar pattern may come from a surface temperature change or a local draught inside the room. Test the air path before naming the cause.
Moisture is another common source of confusion. Wet materials can respond differently to temperature changes. So can shaded surfaces, reflective finishes and materials with different heat capacity. Treat moisture as a possibility that needs confirmation, not as a fact pulled from a colour scale.
Use words that match the evidence. “Thermal anomaly consistent with possible insulation discontinuity” is safer than “failed insulation” when no opening-up work has taken place.
Rank confidence in each finding. High-confidence findings have a clear pattern, good conditions and supporting visual evidence. Medium-confidence findings may need a repeat scan or targeted opening-up. Low-confidence findings should remain observations, not repair instructions.
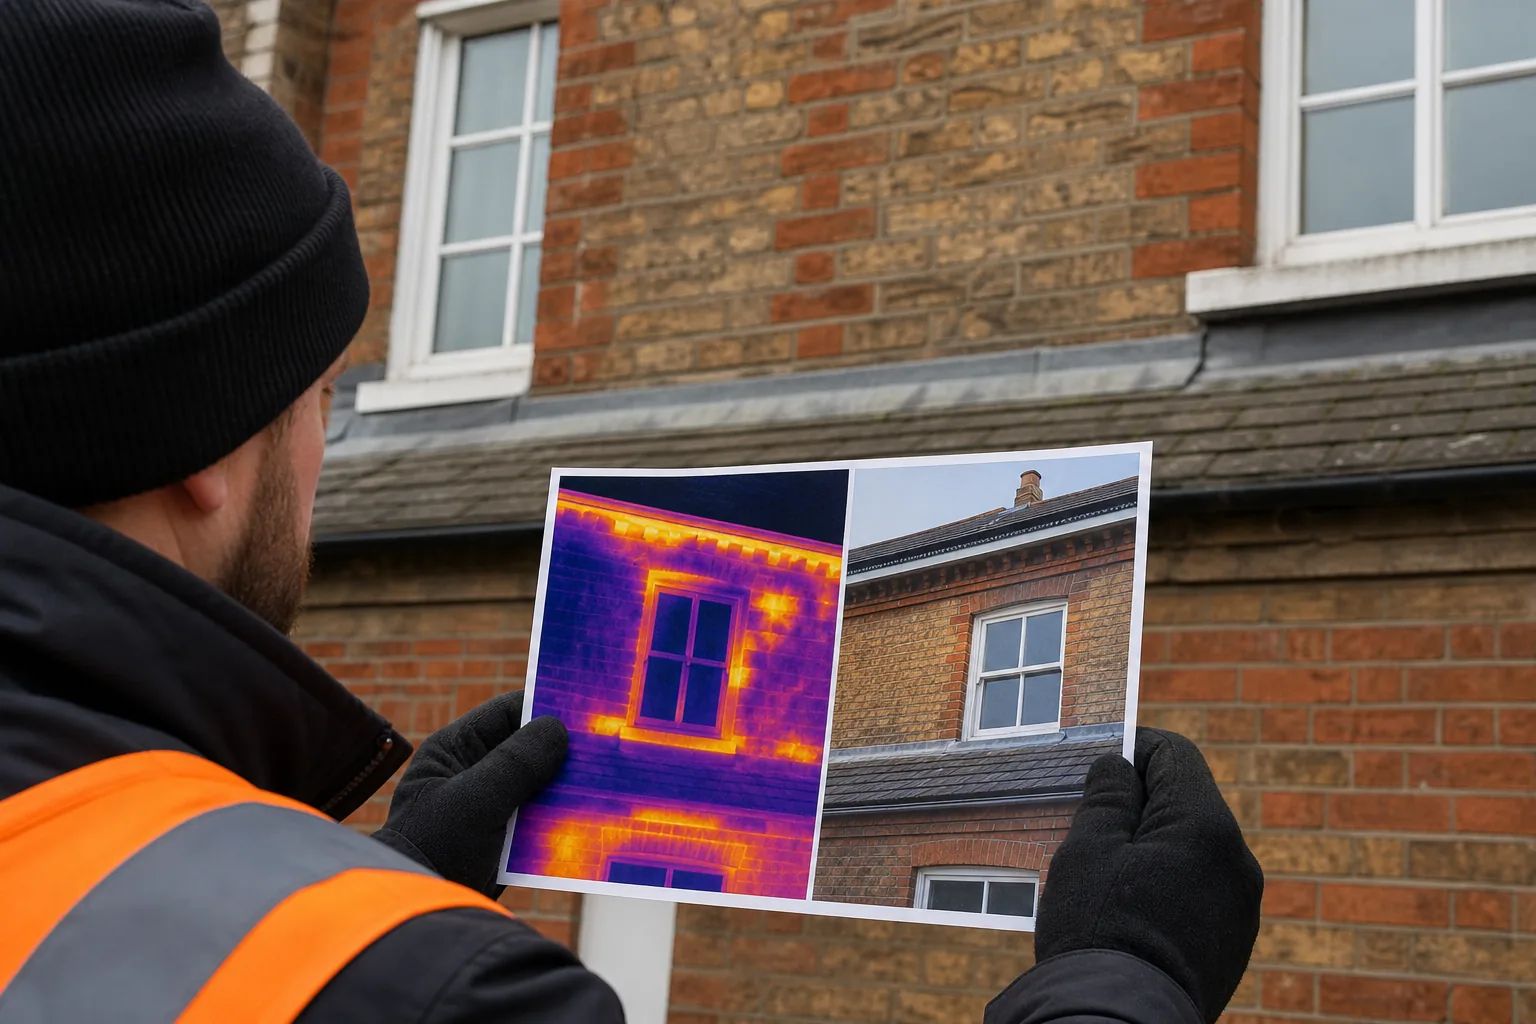
Don’t compare absolute temperatures without context. Emissivity, reflected energy, distance and angle affect the reading. A surface may look hotter because of its finish rather than because heat is escaping through the fabric.
Findings should also be considered alongside the building’s use. A warm patch behind a server room may be expected. The same patch beside a cold classroom may deserve a closer look. Thermal interpretation works best when the survey team understands the building as well as the camera.
By now you should have a list of anomalies with confidence levels and suggested checks. That list is more useful than a report that labels every colour change as a defect.
Step 5: Produce an Actionable Report and Prioritise Remedial Work
A useful report helps a person decide what happens next. It should let an asset manager find the issue, understand the evidence and choose the right follow-up.
Begin with a short executive summary. State the buildings inspected, the survey conditions and the main findings. Separate confirmed observations from possible causes. Explain where conditions limited the result.
Then set out each finding in a consistent format. Include:
- A reference number and exact location.
- A visual photograph beside the thermal image.
- A short description of the observed pattern.
- The likely building element involved.
- A confidence level and limitation.
- A recommended next action.
Make the next action specific. “Investigate roof area R-04 with a moisture survey” is better than “monitor roof”. “Check window perimeter seals in rooms 12 to 18” gives a maintenance team something it can schedule.
Prioritise work against risk, not colour intensity. A small defect above a sensitive clinical area may need faster action than a larger heat-loss pattern in a low-use store. Consider safety, water entry, occupant comfort, energy waste and the chance of further damage.
Use a simple priority system that your client already understands. For example, urgent work may involve active water entry or a safety concern. Planned work may involve repeat heat loss across a known junction. Watch items may need better evidence before money is assigned.
Include a clear data trail. State the equipment type where relevant, the survey date, the conditions and the method used to reference locations. Public-sector teams often need to pass the report between estates, finance and project teams. Clear records prevent the same question returning at each handover.
Visual Perspectives Limited provides actionable defect diagnostics alongside thermal imaging and 3D mapping. The focus is on translating what the camera shows into a repair or investigation decision, rather than leaving the reader to interpret a gallery of images.
For estate programmes, group findings by building element. A manager may want to plan window repairs across several schools. A retrofit team may need to separate insulation continuity issues from moisture risks. Grouping makes the capital plan easier to review.
Don’t use thermography as a substitute for every other survey. Arrange opening-up work, moisture testing or air leakage testing when the evidence calls for it. The strongest workflow is staged. Thermal imaging finds the area. A targeted test confirms the cause. The repair team then works from a known location.
Review the report with the people who will act on it. Ask whether a contractor could find each location without a second site visit. Ask whether the wording separates fact from interpretation. If the answer is no, revise the report before it enters the asset record.
A good report turns a heat-loss survey into an asset-management tool. It helps public-sector estates spend first where the evidence shows a credible risk or a clear opportunity to improve fabric performance.
FAQ
What is building envelope thermography?
Building envelope thermography uses an infrared camera to record surface temperature patterns across roofs, walls, windows and junctions. The images can point to heat loss, air leakage, cold bridging or possible moisture. A building envelope thermography guide should stress that the image identifies an area for review. It does not prove the defect cause by itself.
What weather is best for a thermal imaging survey?
Stable conditions with a useful indoor-outdoor temperature difference are usually best for a thermal imaging survey. Rain, strong wind and direct sunlight can distort surface patterns. Keep heating conditions steady and record shade, wind and recent weather. A competent thermographer will decide whether the conditions support reliable evidence before continuing.
Can thermal imaging find damp in a roof or wall?
Thermal imaging can show patterns that may be consistent with damp materials, but it cannot confirm moisture on its own. Wet areas can heat and cool differently from dry areas. Confirm suspicious locations with a moisture survey or targeted investigation. Treat the thermal image as a way to focus that follow-up work.
Is a drone roof survey suitable for public-sector estates?
A drone roof survey can suit public-sector estates when roof access is difficult or work at height would add risk. The operator still needs a site risk assessment and a plan for people, buildings and airspace. Thermal capture is most useful when the final report links each finding to a roof plan or 3D model.
What should a thermography report include?
A thermography report should include survey scope, conditions, image references and clear next actions. Each important finding should pair a thermal image with a normal photograph and an exact location. It should also state limitations and separate observed evidence from the suspected cause. That makes the report useful for maintenance and retrofit decisions.
Conclusion
Plan the question first, control the survey conditions and treat every thermal anomaly as evidence that needs context. For UK estates that need mapped, independent building diagnostics, Visual Perspectives Limited can provide thermal imaging with drone-based 3D mapping and actionable reporting. Start by listing the buildings and decisions the survey must support, then request a scope that matches them.