Visual Perspectives Limited provides managed drone‑based aerial inspections, delivering high‑resolution thermal imaging for commercial roofs and façades across the UK.
Commercial building owners waste time and money chasing leaks that hide in plain sight. A thermal imaging report shines a light on those hidden problems, letting you act before a small issue turns into a costly repair. In this guide we’ll break down what a thermal imaging report looks like, how the data is gathered on a roof, the pieces that make up the final document, and how you can turn the findings into real‑world savings and greener operations.
By the end you’ll know the exact steps to request a report, what to expect in the deliverable, and how to use the insights to lower risk, cut energy waste, and meet decarbonisation goals across your portfolio.
What Is a Thermal Imaging Report?
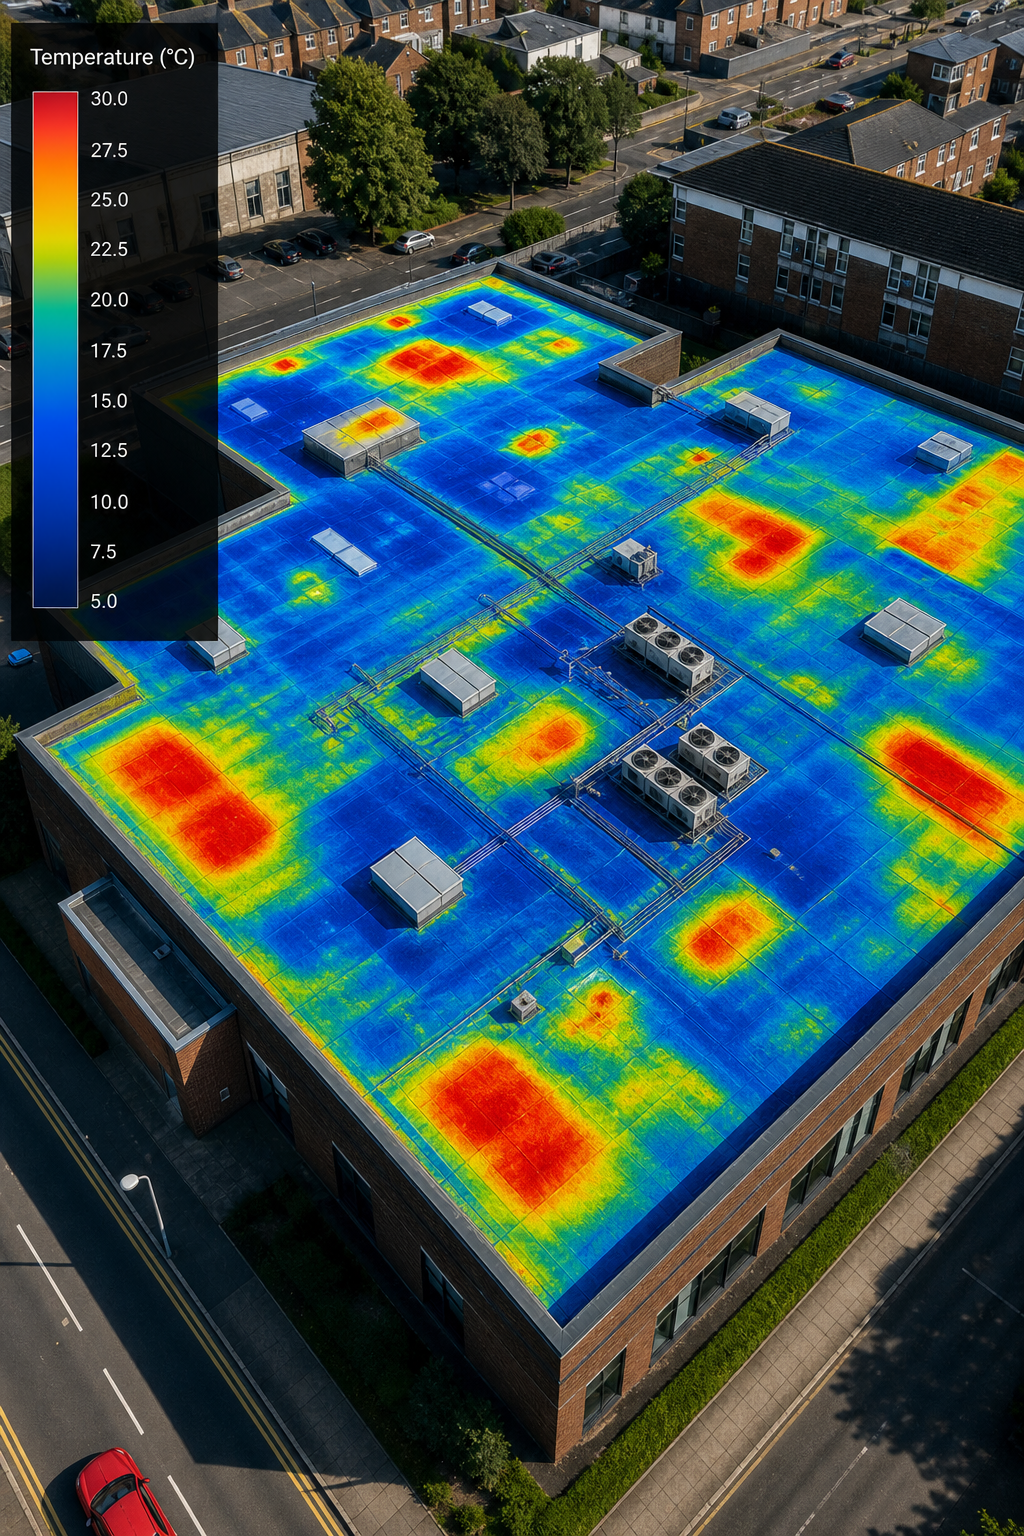
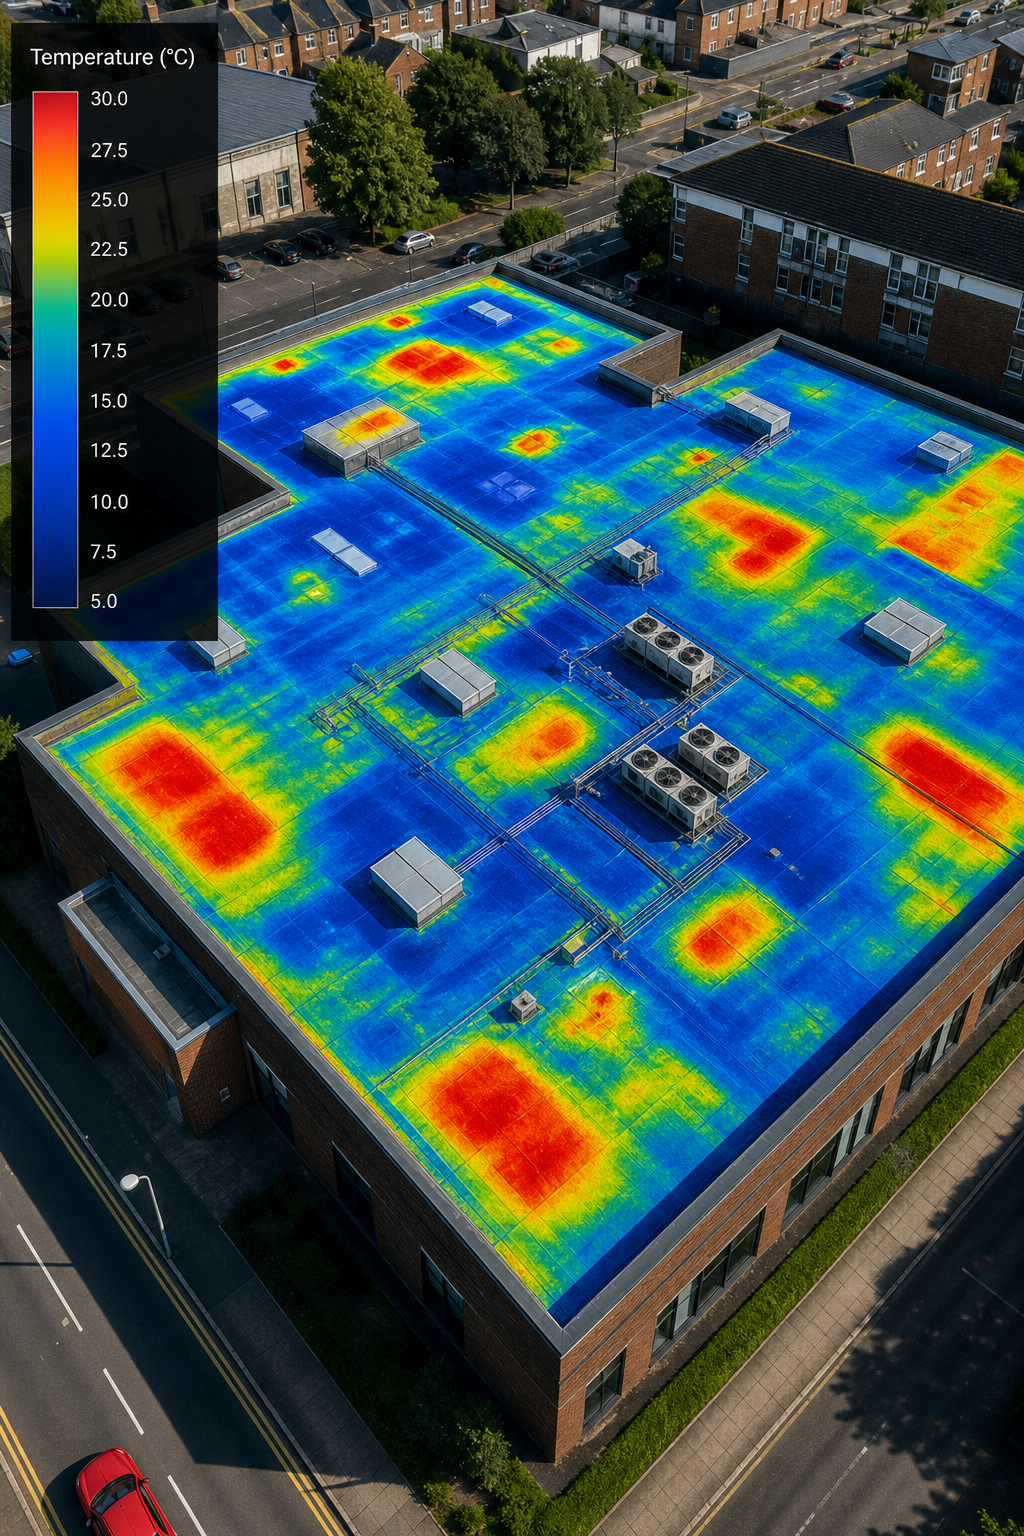
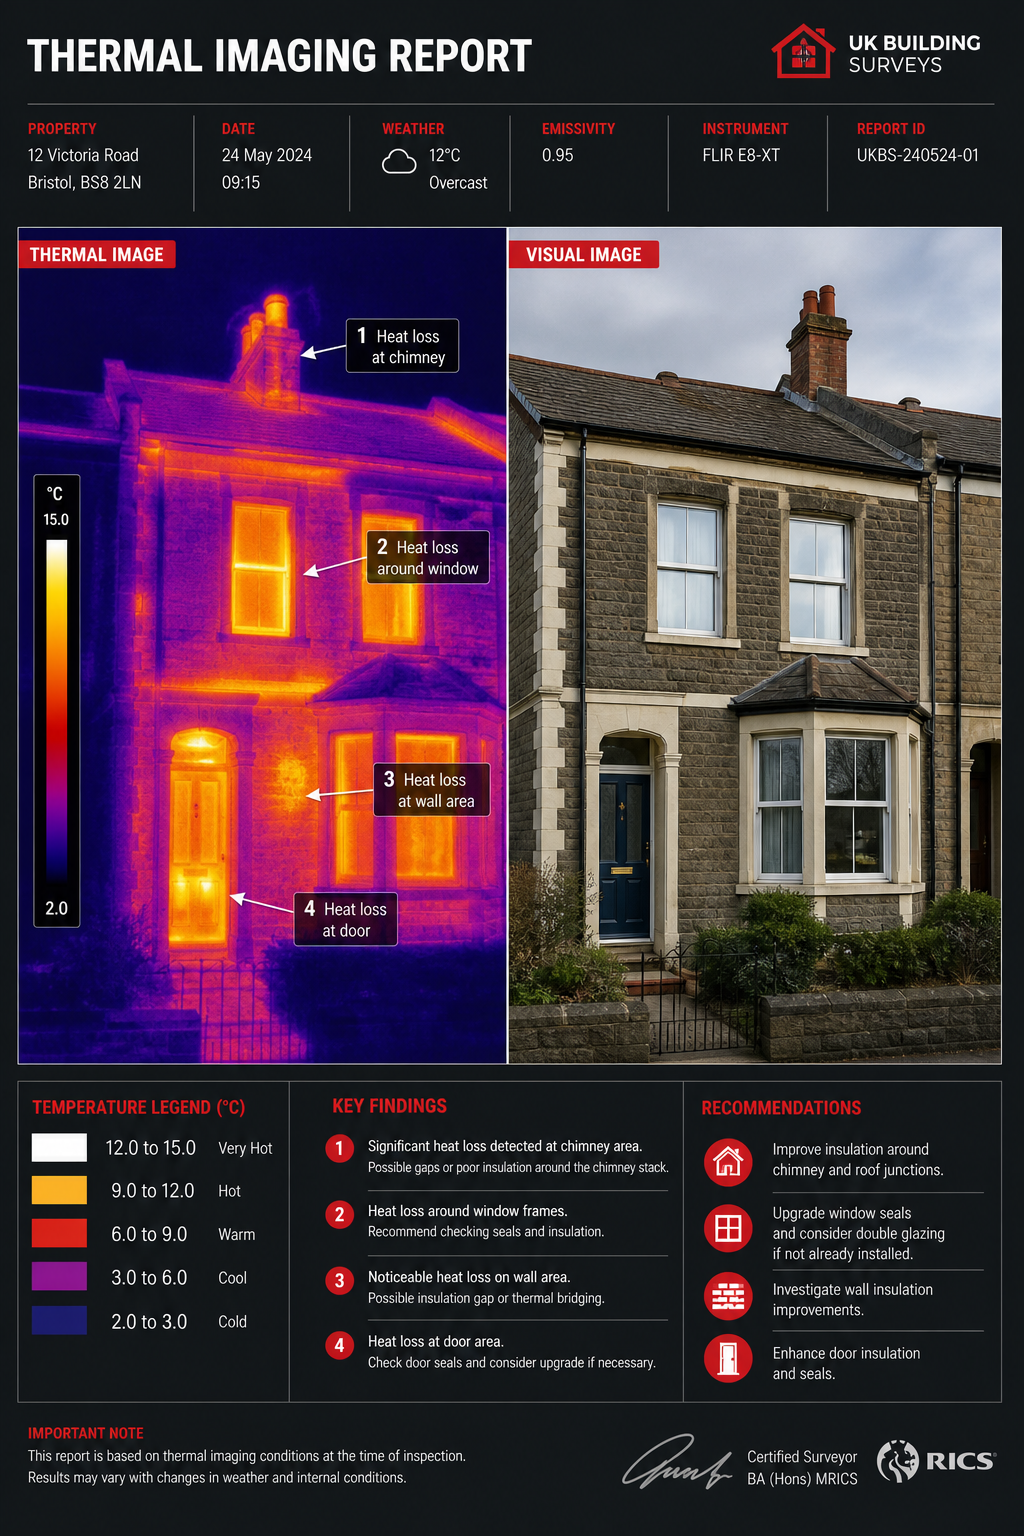
A thermal imaging report is a written document that combines infrared thermograms with clear, plain‑language commentary. These thermograms illustrate temperature variations across a surface, highlighting hotter or colder spots that may indicate defects such as a hot joint, hidden moisture, or a failing electrical element.
During a commercial survey a qualified thermographer walks the roof while a drone equipped with a calibrated infrared camera captures data. The drone operates at a safe altitude, records both visual and thermal imagery, and tags each frame with GPS coordinates. After the flight, the thermographer aligns the thermal layer with the high‑resolution RGB photos, records weather, load, and material details, and assigns a severity rating to each observation.
The final report typically contains:
- A roof map pinpointing hot‑spot locations.
- Thermal images displayed alongside high‑definition visual photographs.
- Explanations of why each temperature anomaly matters.
- A risk rating categorised as Priority 1, 2, or 3.
- Actionable recommendations for remediation.
Because the data is gathered while the building operates under normal conditions, the report reflects real‑world performance rather than a contrived test. This makes it a reliable resource for insurers, facilities managers, and asset owners who require evidence of condition without interrupting services.
Our own Thermal Imaging Archives showcase dozens of past commercial reports, each formatted to comply with IEC 62446 and UK insurance standards. The consistent layout enables easy comparison of findings across multiple sites.
According to the thermography definition on Wikipedia, infrared cameras detect radiation emitted by objects based on temperature. This scientific principle underlies every thermal image produced during a drone‑based inspection.
How Thermal Imaging Works in Commercial Roof Inspections
First, we plan the flight. We look at roof geometry, access points, and local weather forecasts. The goal is to capture the roof when solar gain has warmed any trapped moisture, but the ambient air has cooled enough to highlight temperature differences.
We launch our drones at sunset, flying a pre‑programmed grid. The IR sensor records temperature data at 25 Hz, delivering smooth, real‑time thermal video. Simultaneously, a high‑resolution RGB camera captures visual images. Both data streams are synced so each thermal pixel aligns perfectly with its visual counterpart.
After the sun sets, we return for a second pass. As the ambient air drops, wet insulation stays warm longer, while dry areas cool quickly. This contrast makes hidden moisture pop out in the thermal image.
Back on the ground, a qualified thermographer calibrates the images, corrects for emissivity, and flags any anomalies. The calibrated thermograms are then stitched into a 3‑D model of the roof, allowing you to rotate the view and zoom into any hot spot.
Why does this matter to you? Because the data is collected without ladders or scaffolding. That cuts labor costs, reduces safety risk, and leaves the roof untouched , a big win for any large‑scale asset programme.
We also tie the data to the Drone Roof Survey guide, which explains how the aerial model integrates with your existing BIM or CAFM system. The result is a single source of truth that can be queried for heat loss, moisture intrusion, or structural concerns.
Our approach follows the ISO 18436‑7 standard for thermographic testing, ensuring that the methodology is repeatable and auditable.
Key Components of a Thermal Imaging Report
Every report we deliver has a consistent set of sections, so you always know where to look for the information you need. Below is a walk‑through of each component.
1. Executive Summary, A concise one‑page overview that highlights the most critical findings, assigns a risk rating, and outlines the top three actions to address first. This enables senior managers to make rapid decisions without wading through detailed technical data.
2. Site Overview, Provides a map of the building footprint, roof type, and any photovoltaic arrays. GPS coordinates are included so each observation can be located precisely within a GIS platform.
3. Thermal Image Gallery, A grid of paired thermal and visual photographs. Each pair is tagged with a unique identifier, capture date and time, and ambient temperature. The searchable gallery allows surveyors to retrieve the exact image required for analysis.
4. Findings Matrix, A table that records every hotspot, its temperature delta (difference from surrounding material), the probable cause (e.g., moisture ingress, insulation failure, electrical overload), and a severity rating.
5. Recommendations, For each finding we propose a remediation pathway: immediate repair, scheduled monitoring, or further investigation with a specialist. Advice is aligned with relevant standards such as IEC 62446 for photovoltaic systems and BREEAM for overall energy performance.
6. Appendices, Contains raw data files, calibration certificates for the thermal imaging equipment, and a log of flight conditions. This documentation satisfies auditors who require evidence of the inspection process.
Our Building Defect Thermography service ensures that each component is produced with the same level of care that earned Visual Perspectives Limited £5 million in public liability insurance and ITC Level 1‑2 credentials.
Interpreting Findings: Benefits for Asset Management
Reading a thermal imaging report is straightforward once you know what each symbol means. Here’s how you can turn the data into value.
When you see a Priority 1 issue, act fast. These are the defects that can cause water damage, electrical fires, or rapid energy loss. A quick fix saves you from expensive downtime later.
Priority 2 findings deserve a close look but can be scheduled into regular maintenance windows. Because the report ties each hotspot to a specific location, you can send a crew directly to the spot, reducing inspection time on site.
Priority 3 items are usually minor , perhaps a small thermal variance caused by shading. Still, they’re useful for long‑term tracking. By logging the temperature delta each year, you can spot trends that indicate gradual degradation.
For facilities managers, the report becomes a key input to the building’s Energy Management System (EMS). You can feed the heat‑loss data into the EMS to calculate potential savings from insulation upgrades or roof repairs.
“A thermal imaging report is the only way to see what the naked eye can’t see on a commercial roof,” says an independent building surveyor.
Because the data is compliant with IEC 62446, it also satisfies insurance requirements for solar PV systems. Insurers often lower premiums when they see a recent, standards‑based report.
In our experience, clients who act on the top three recommendations see a 5‑10% reduction in heating energy use within a year. That’s a tangible win for decarbonisation targets.
You’ll be in good hands knowing the report is backed by certified thermographers, high‑resolution drone imagery, and a clear, repeatable workflow.
FAQ
What does a thermal imaging report cover?
A thermal imaging report covers roof‑level temperature anomalies, moisture intrusion, insulation failures, and electrical hot spots. It pairs each thermal image with a visual photo, adds GPS coordinates, and grades the issue by risk. The document also includes a recommendations section that tells you exactly what to fix, when to monitor, and how the finding fits into standards like IEC 62446.
How often should I get a thermal imaging report?
Most commercial owners schedule a scan every 12‑18 months, especially if they have solar PV arrays or flat roofs. If you have a history of water ingress, an annual scan helps catch problems early. For new builds, a post‑construction scan verifies that the roof envelope is performing as designed.
Can the report be used for insurance claims?
Yes. Because the report follows IEC 62446 and includes calibrated data, insurers accept it as proof of condition. The severity grading and clear remediation steps make it easy for underwriters to assess risk and adjust premiums accordingly.
Do I need to be on site during the drone flight?
No. Our pilots handle all flight planning and safety checks. We do need a brief site walk‑through before the flight to note access points, safety hazards, and any areas you want us to focus on. After the flight, we deliver the full report within the agreed turnaround time.
What equipment do you use for the thermal scan?
We fly drones equipped with high‑resolution thermal cameras that capture 256 × 192 pixel infrared images at 25 Hz. The cameras are calibrated before each flight, and the drone’s GPS ensures each image is accurately geotagged. This combination gives you quickly, precise, and detailed data you can trust.
How does the report help with decarbonisation?
By identifying heat loss and moisture that reduces insulation efficiency, the report points out where you can improve the building envelope. Fixing those issues can cut heating demand by several percent, directly lowering your carbon footprint and helping you meet ESG targets.
Is the data secure?
All raw data and final PDFs are stored on encrypted servers that comply with UK data‑protection laws. Access is limited to your project team via a password‑protected portal, and we can set expiry dates for each user.
What if I need a deeper dive on a specific hotspot?
We offer a re‑scan service. A follow‑up flight focuses on the exact coordinates of the hotspot, giving you higher‑resolution thermal data and a more detailed analysis. This is useful for complex issues like PV inverter overheating.
Conclusion
Thermal imaging reports give you a clear, data‑driven view of what’s happening under the surface of your commercial roof. They let you spot moisture, insulation loss, and electrical hot spots before they become emergencies. Because the data is captured with drones, you avoid scaffolding, reduce labor costs, and keep the building in service while you inspect it.
With a report that follows IEC 62446, you satisfy insurance requirements, meet ESG goals, and give your facilities team a usable roadmap for repairs and upgrades. Our “quickly, precise, and detailed” approach, backed by 20 years of experience and ITC Level 1‑2 credentials, means you’ll be in good hands from start to finish.
If you’re ready to turn hidden heat signatures into actionable insights, reach out to Visual Perspectives. Our team will plan the flight, capture the data, and deliver a report that you can trust to protect your assets and support your decarbonisation strategy.