Solar panels on a commercial roof can look perfect, but hidden hot‑spots can steal energy and raise fire risk. If you miss those problems, you lose money and invite trouble. In this article we break down the eight most common thermal inspection methods you can use on a commercial PV array. You’ll see how each method works, what equipment you need, the pros and cons, and which projects they fit best.
1. Drone-Based Aerial Thermography , The Gold Standard for Commercial Arrays
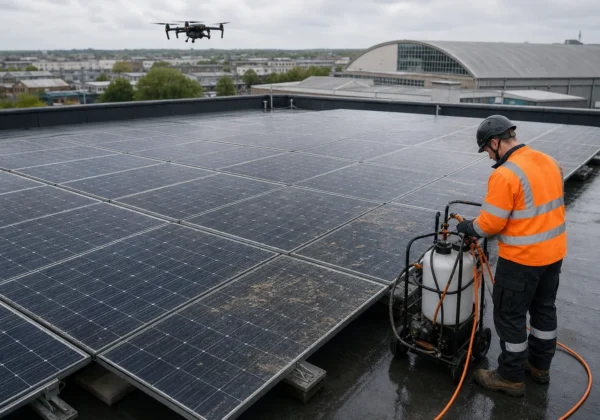
When you need a quick, precise, and detailed look at hundreds of panels, a drone does the job. A drone flies over the roof, captures thousands of thermal frames, and stitches them into an ortho‑mosaic. That mosaic lets you spot hot‑spots, mismatched cells, and shading issues without climbing a ladder.
Visual Perspectives Limited runs a CAA‑authorised fleet equipped with 640×512 radiometric cameras. The cameras meet the resolution floor set by IEC 62446‑3:2017, which requires at least 640×480 pixels for reliable fault detection. By flying at a height that balances field‑of‑view and detail, usually 30‑50 m, you get enough ground‑sample distance to see cell‑level anomalies while covering the whole array in one flight.
Why does this matter for a commercial building? First, you cut inspection time from days to under an hour. Second, the data is geotagged, so you can tag each hot‑spot with exact panel IDs. Third, the report is IEC 62446‑compliant, which helps with warranty claims and insurance paperwork.
Here’s a quick run‑through of the workflow:
- Plan the flight in software that respects local airspace rules.
- Check solar irradiance (600 W/m² or higher) to get good temperature contrast.
- Launch the drone and let it follow an autonomous grid.
- Upload the thermal images to a cloud platform that stitches and analyses them.
- Review the heat‑map, flag anomalies, and generate a report with panel‑by‑panel coordinates.
Because the drone never touches the roof, you avoid the safety hazards of climbing. You also avoid disrupting the system , the panels stay online while you fly.
According to independent research, aerial thermal imaging can recover 2–5% of annual energy loss that would otherwise go unnoticed. That translates into thousands of pounds saved on a 5 MW installation.
We’ve run dozens of commercial projects across the UK, from hospitals to university campuses. Our clients tell us they appreciate the speed, the compliance‑ready reports, and the fact that the whole process is “quickly, precise, and detailed.” You’ll be in good hands.
2. Handheld Infrared Cameras , Quick Spot Checks for Small Rooftops
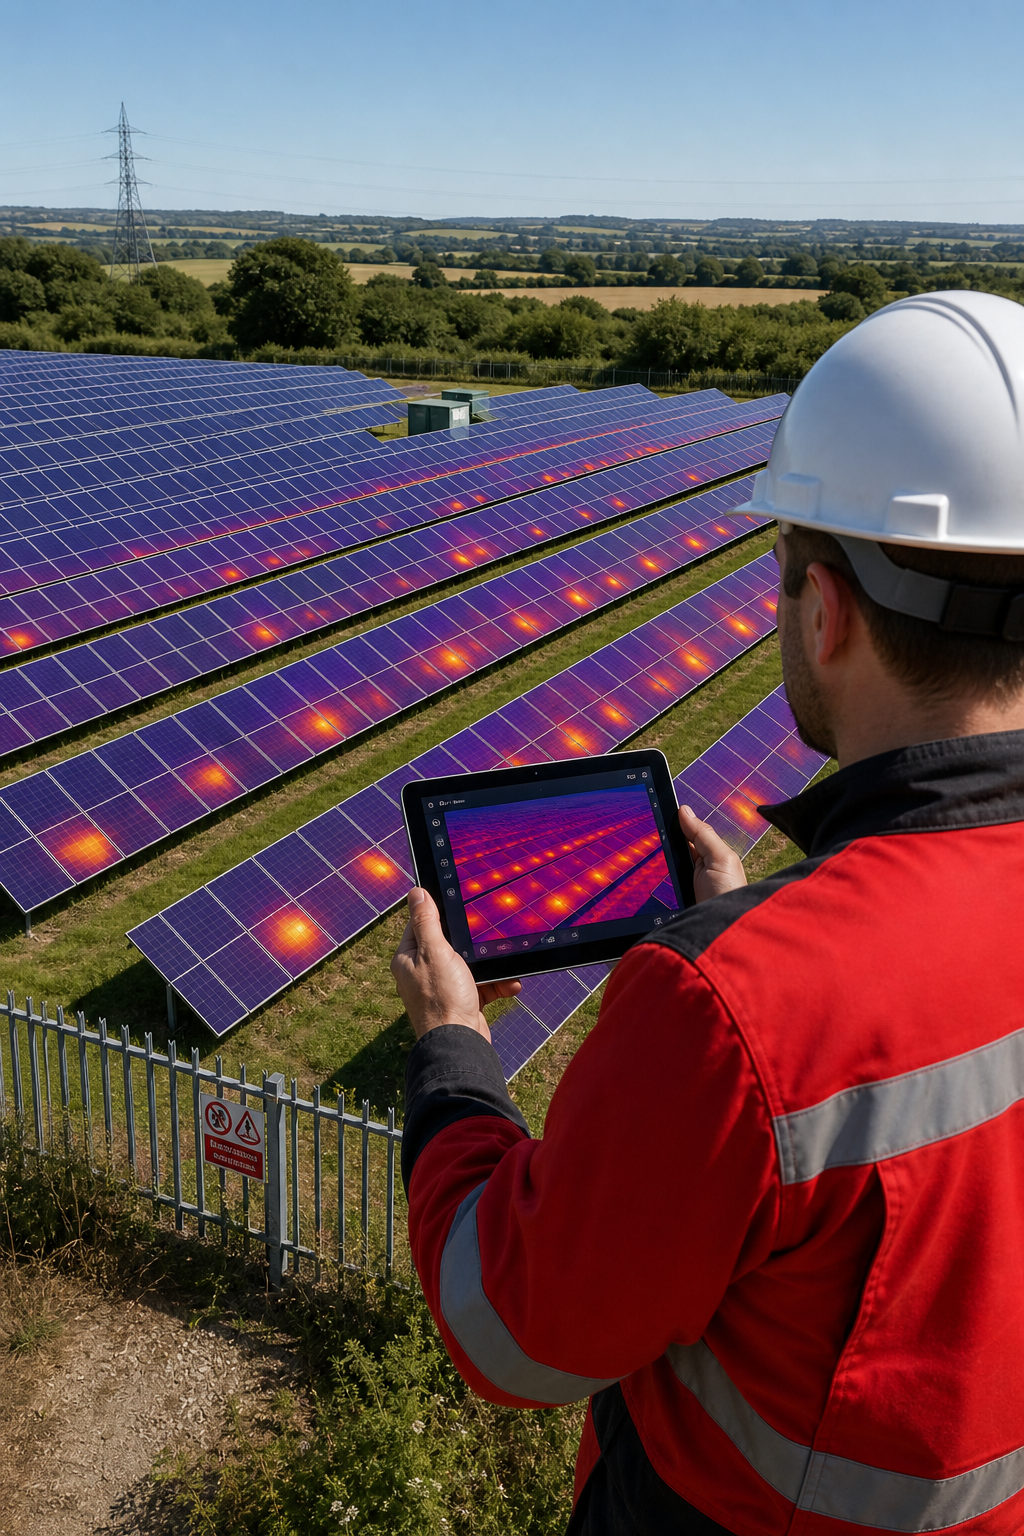
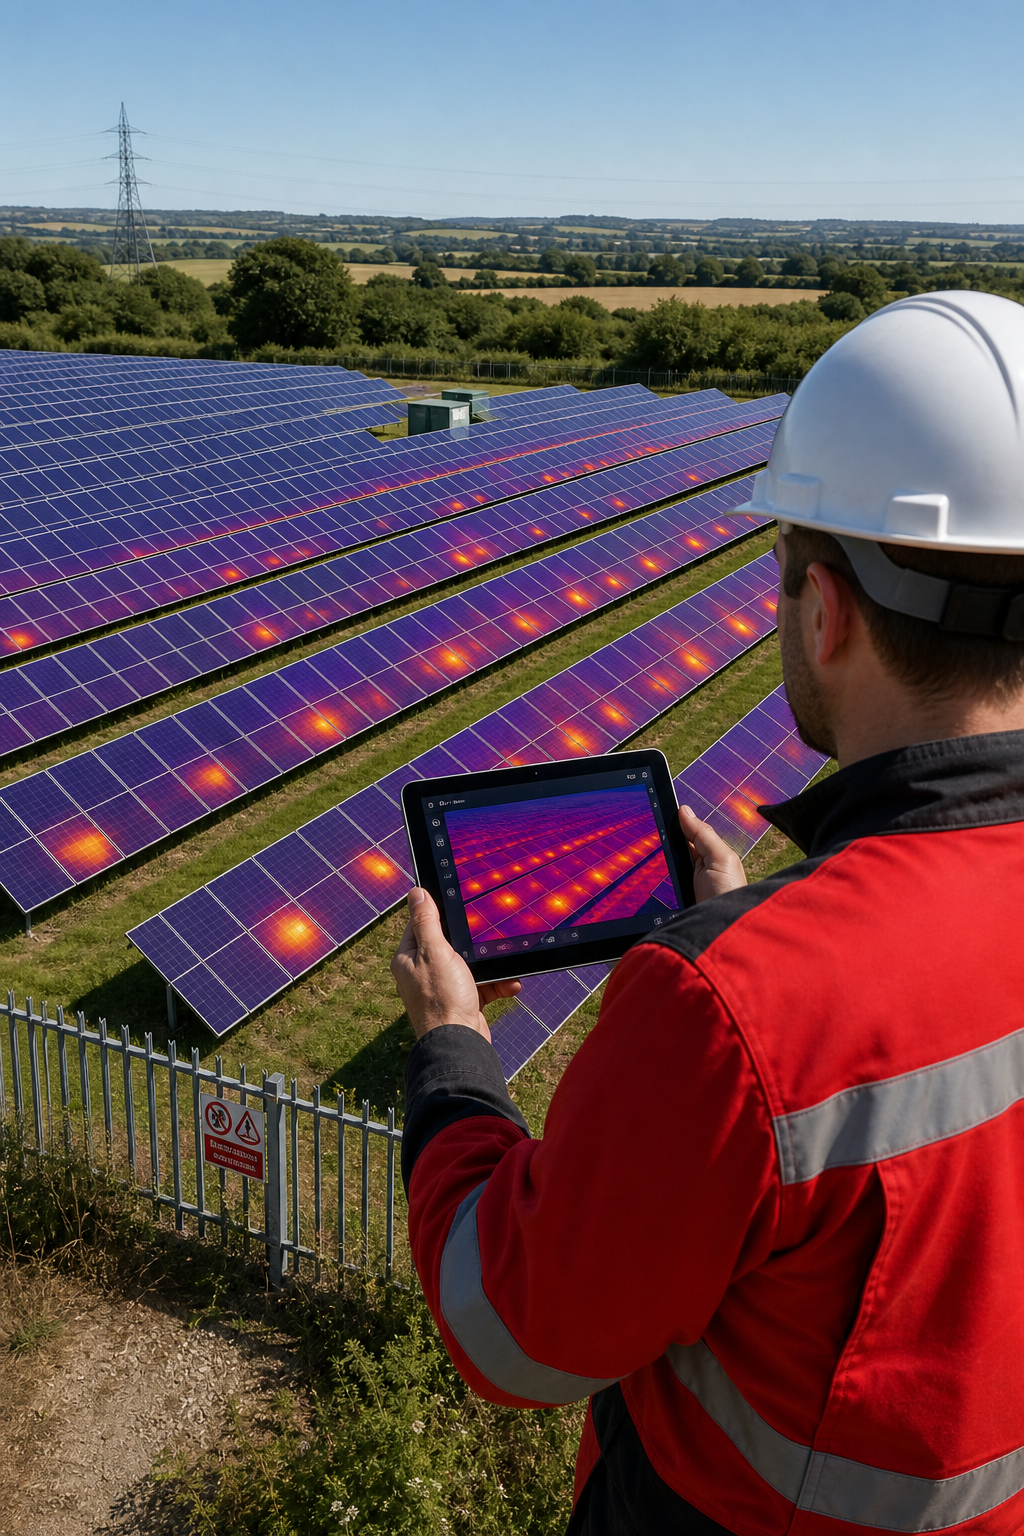
If you have a modest rooftop array, say under 200 kW, sending a drone may be overkill. A handheld infrared camera lets a technician walk the rows, point the lens at each panel, and see temperature differences in real time.
Modern handheld units cost a few thousand pounds and deliver resolutions of 320×240 pixels or better. They also offer a NETD (noise‑equivalent temperature difference) of 0.05 °C, which is enough to see a cell‑level fault.
Typical steps:
- Calibrate the camera using a black‑body reference.
- Set the emissivity to 0.95 (the value for glass‑covered PV cells).
- Walk the array, pausing every few panels to take a reading.
- Mark any panel that shows a temperature rise of more than 5 °C above its neighbours.
- Log the panel IDs in a spreadsheet and hand the list to the maintenance crew.
This method is especially useful when you need a rapid check before a scheduled service. It also works well for verifying a specific issue, like a shading problem caused by new rooftop equipment.
Because you’re on the roof, safety gear is mandatory, hard hat, use, and slip‑resistant shoes. The process takes about 10 minutes per 100 kW of capacity, so a 150 kW system can be checked in under an hour.
For a deeper dive on how to run a commercial inspection, How to Conduct a Commercial Solar Panel Inspection. It walks you through the paperwork, the safety checklist, and the data‑capture standards you need to meet.
While handheld cameras lack the breadth of a drone, they give you the flexibility to focus on a suspect area. That makes them a good companion tool for large‑scale projects where you might want to double‑check a hotspot flagged by aerial data.
3. Lock‑In Thermography , Lab‑Grade Defect Analysis for Warranty Claims
When a warranty claim hinges on a specific defect, you need the most accurate thermal data possible. Lock‑in thermography does that by modulating the heat input and measuring the panel’s response at precise frequencies. The result is a quantitative map of thermal resistance across each cell.
The technique requires a lab‑style setup: a thermal camera, a heating element that can be pulsed, and a control unit that synchronises the pulse with the camera’s frame capture. The data is then processed with software that extracts the phase angle of the temperature signal, which correlates directly with defects like micro‑cracks or delamination.
Why choose lock‑in for a warranty case?
- The measurement is repeatable, so you can prove the defect existed at the time of claim.
- It can detect sub‑cell‑level issues that ordinary thermography misses.
- The report includes numerical values (e.g., thermal resistance in K·m²/W) that manufacturers recognise.
The downside is cost and logistics. You need to bring a portable lab to the site or take panels back to a facility. The process can take a full day for a 1 MW array, so it’s best reserved for high‑value projects or disputed claims.
Our team can coordinate with manufacturers to ensure the lock‑in data meets their specific warranty criteria. That saves you from a back‑and‑forth with the warranty department.
When the analysis is done, the report is formatted to IEC 62446‑1:2016 standards, making it easy to attach to insurance or loan documentation.
Remember, the goal is to turn a vague “hot‑spot” into a quantified fault that a warranty clause can address.
4. Fixed‑Mount Thermal Monitoring , Real‑Time Alerts for Large Solar Farms
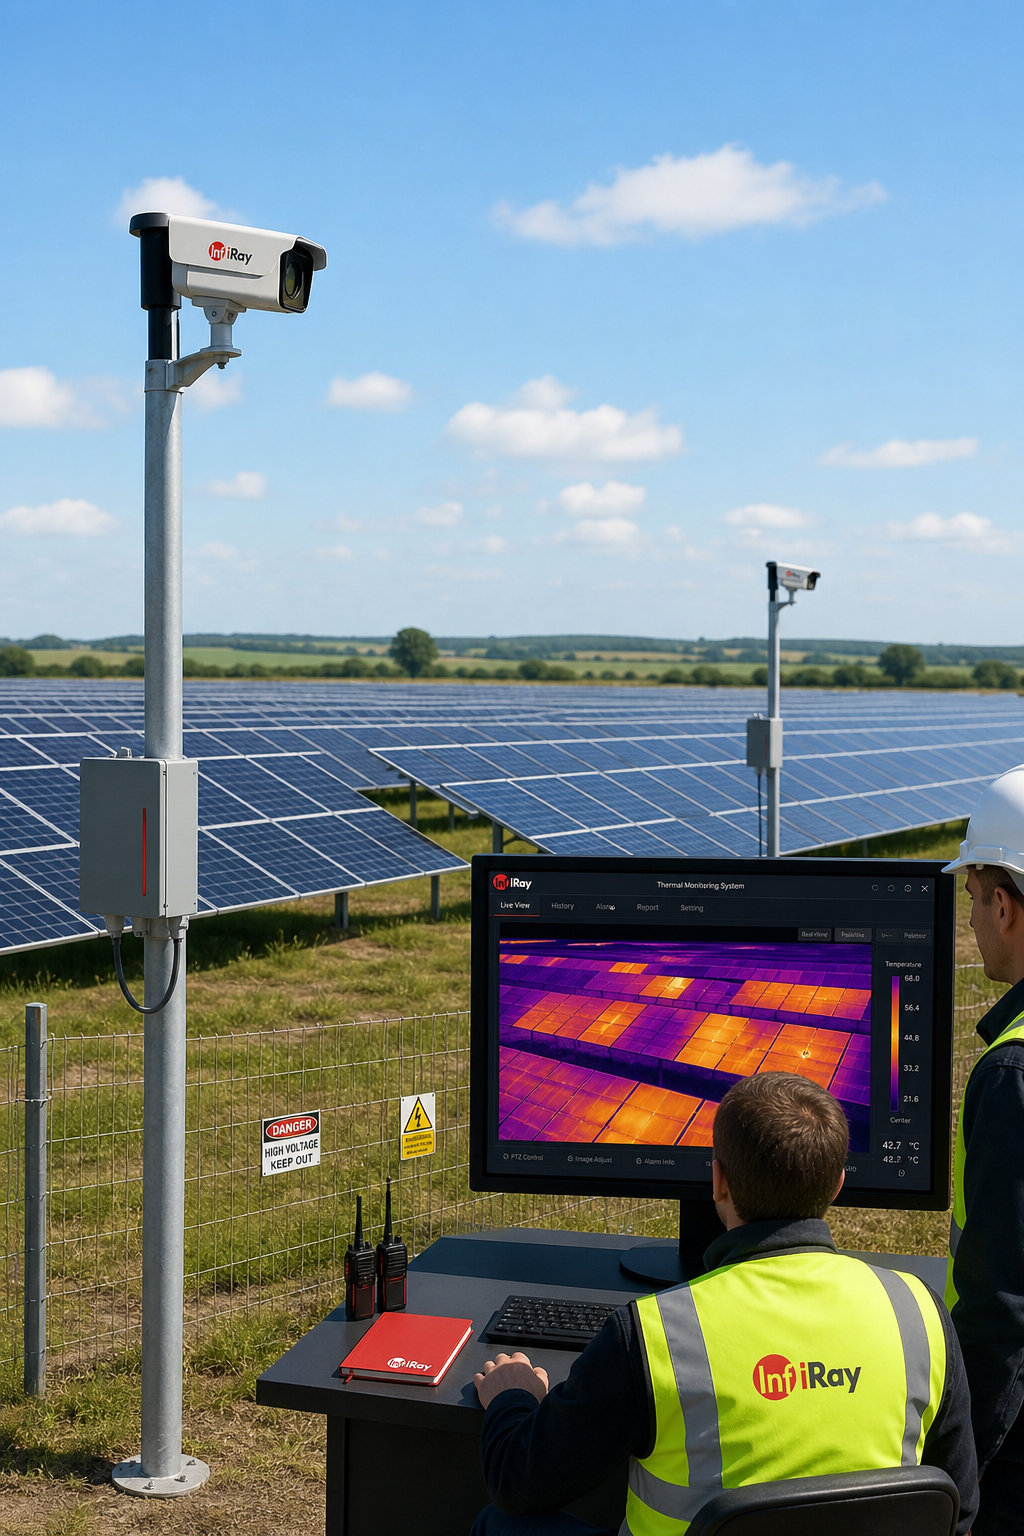
For utility‑scale farms, waiting weeks for a manual inspection is not an option. Fixed‑mount thermal cameras give you continuous temperature data, so you can spot a failing string the moment it heats up.
A typical setup uses four cameras arranged around a panel row, each covering a 120° sector. The cameras feed a central processor that runs a real‑time algorithm to flag temperatures that exceed a preset threshold. The software can push an alert to a SCADA system, triggering a work‑order automatically.
The advantage is obvious: you get instant fault detection, reduced downtime, and the ability to trend panel health over months. The downside is the upfront hardware cost and the need for a reliable power source and network connection on the site.
Fixed‑mount thermal monitoring software merges streams from up to eight cameras, applies ROI (Region Of Interest) calculations, and sends alarm signals directly to PLCs via Modbus or OPC IEC 62446 documentation. That integration means the thermal alarm becomes part of the normal control loop, just like an inverter fault.
Our engineers can design a custom layout that matches the geometry of your farm, ensuring every panel is covered without blind spots. Once installed, the system runs 24/7, only requiring periodic calibration.
Clients love the peace of mind that comes from knowing the farm is being watched around the clock. You’ll be in good hands.
5. Electroluminescence (EL) Imaging , Complementary Defect Detection
EL imaging is a different way to look inside a panel. Instead of measuring heat, you bias the panel in the dark and capture the faint light emitted by healthy cells. Cracks, broken interconnects, and micro‑cracks appear as dark lines in the EL image.
The equipment is a high‑sensitivity camera paired with a portable power supply that can deliver up to 30 V to the panel. You place the camera a short distance away, turn off the lights, and trigger the bias. The resulting image shows the electrical continuity of each cell.
EL is especially useful when you have a warranty claim that cites “cell‑level defects.” While thermal imaging shows where a panel is hot, EL tells you why the panel is hot , a broken cell, a faulty bypass diode, or a micro‑crack.
Because the test is done in a dark environment, you often need a portable tent or a night‑time schedule. The process takes about 5 minutes per panel, so it’s best for a focused audit of suspect modules rather than a full‑farm scan.
Our team can combine EL data with thermal maps to give you a full picture: thermal shows the symptom, EL shows the cause.
For ongoing maintenance, you can schedule EL checks once a year for high‑value assets. The results feed directly into your asset‑management software, helping you track degradation trends over the life of the system.
6. Automated AI‑Driven Fault Classification , Speed Up Report Generation
AI is changing the way we read thermal data. Instead of a technician scrolling through thousands of frames, a trained neural network flags anomalies in seconds.
A dedicated AI platform, for example, ingests raw thermal video, runs a defect‑detection model, and outputs a geo‑referenced defect list. The model can differentiate between hot‑spots caused by soiling, shading, or actual cell failure with 90+% accuracy.
How it works:
- Upload the thermal video and GPS log.
- The AI splits the video into frames and extracts temperature contours.
- A classification layer labels each contour as “soiling,” “shading,” “cell fault,” or “normal.”
- The output is a GIS‑ready file that you can drop into your asset‑management system.
The biggest win is time. A 2‑hour drone flight can be turned into a finished report in under 15 minutes. That means you can run weekly inspections on a large portfolio without adding staff.
Because the AI model is trained on thousands of real‑world panels, it handles different panel technologies, mono‑crystalline, poly‑crystalline, bifacial, without extra tuning.
We integrate the AI output into our IEC‑compliant reports, so you get the speed of automation with the rigor of a formal inspection.
7. Combined Thermal + 3D Mapping , The Ultimate Asset Management Tool
Imagine having a 3‑D model of your entire solar farm that also shows temperature data. That’s what combined thermal‑video mapping delivers. A drone flies a smooth grid, records both RGB and thermal video, and the software builds a point‑cloud model while stitching the thermal frames onto it.
The result is a GeoTIFF orthomosaic that you can overlay on your SCADA dashboard. Each pixel carries a temperature value, and the 3‑D mesh lets you measure panel tilt, row spacing, and shading angles.
Benefits include:
- One‑flight data capture for both visual and thermal insights.
- Accurate as‑built verification, compare the model to the design drawings.
- Long‑term trend analysis, track how hot‑spots migrate over seasons.
Processing time is fast: a 15‑minute flight yields a processed model in roughly the same time on a cloud platform. The output can be exported as a point‑cloud for use in CAD tools or as a GIS layer for integration with asset‑management software.
For large portfolios, the ability to store a historical series of 3‑D thermal models means you can spot degradation patterns that would be invisible in a single snapshot.
Our workflow follows the IEC 62446 reporting structure, so the final deliverable includes a heat‑map, a 3‑D model, and a compliance checklist.
8. Regulatory Compliance & Reporting , Meeting IEC 62446 and Beyond
Compliance isn’t a nice‑to‑have; it’s often required by lenders, insurers, and warranty providers. IEC 62446 defines the methodology, the environmental conditions, and the report format for solar‑panel thermal inspections.
Key compliance points:
- Clear sky, irradiance ≥ 600 W/m², wind ≤ 5 m/s.
- Camera resolution ≥ 640×480 pixels, NETD ≤ 0.1 °C.
- Geotagged imagery with panel IDs.
- Fault classification aligned with IEC 61829‑1 (string‑level testing).
- Report sections: Survey plan, environmental conditions, analysis, recommendations.
Below is a quick comparison of how each method lines up with the standard.
By choosing a method that meets the standard, you protect yourself from warranty disputes and make the data usable for insurance claims.
Our reports are signed by ITC Level 1 & 2 certified thermographers, ensuring the analysis passes the strictest scrutiny.
How to Choose the Right Thermal Inspection Method for Your Commercial Solar Array
Picking the best method depends on three things: the size of the array, the frequency you need data, and the budget you have.
Start by answering these questions:
- Is the array larger than 1 MW? If yes, a drone or fixed‑mount solution will save time.
- Do you need real‑time alerts? Fixed‑mount cameras are the only option that watches continuously.
- Are you filing a warranty claim? Lock‑in thermography gives the quantitative proof insurers love.
If you answered “yes” to the first item and “no” to the other two, go with drone‑based aerial thermography. It offers the best balance of coverage, speed, and compliance. If you need continuous monitoring, pair a fixed‑mount system with AI‑driven classification so you get instant alerts and rapid analysis.
For smaller roofs, a handheld infrared camera is the most cost‑effective. You can supplement it with a quick EL scan if the thermal data shows a suspect panel.
Our own service catalog lets you mix and match. For example, a client with a 2 MW campus chose a quarterly drone flight plus a permanent fixed‑mount camera on the most critical array. That hybrid approach gave them a baseline, plus real‑time warnings for sudden faults.
Read more about how drones boost efficiency on commercial roofs How Drone Roof Inspections Boost Solar Panel Efficiency. It explains the ROI in plain numbers.
Conclusion
Thermal inspection is the only way to see what the naked eye can’t see on a solar array. From quick handheld checks to full‑scale drone surveys, each method has a place in a commercial‑building strategy. Drone‑based aerial thermography gives you the fastest, most complete coverage and ties directly into IEC 62446 reporting. Handheld cameras are cheap and perfect for small roofs. Lock‑in thermography offers lab‑grade proof for warranty claims. Fixed‑mount systems keep a watchful eye 24/7, while EL imaging drills down to the cell level. AI‑driven classification turns raw data into instant insight, and combined thermal + 3D mapping adds spatial context that makes maintenance planning a breeze.
When you pair the right method with a partner that holds ITC Level 1 & 2 certifications, CAA authorisation, and a £5 million insurance policy, you reduce risk, cut costs, and keep your decarbonisation goals on track. Visual Perspectives Limited brings all of those credentials together, so you can trust the data and move forward confidently.
Ready to see the hidden heat signatures on your commercial PV system? Explore our full range of services and start a compliance‑ready inspection today.