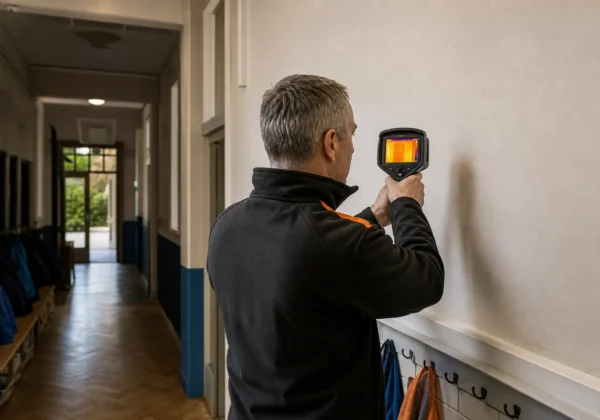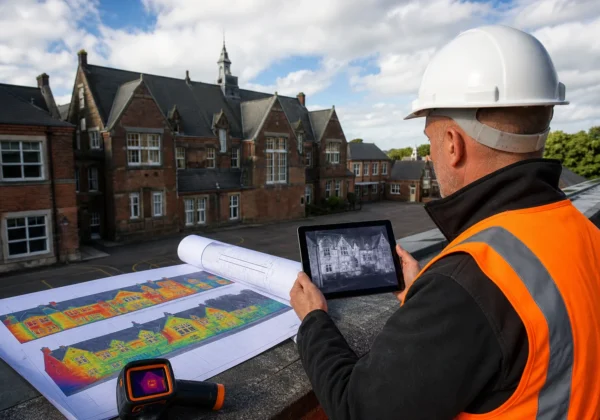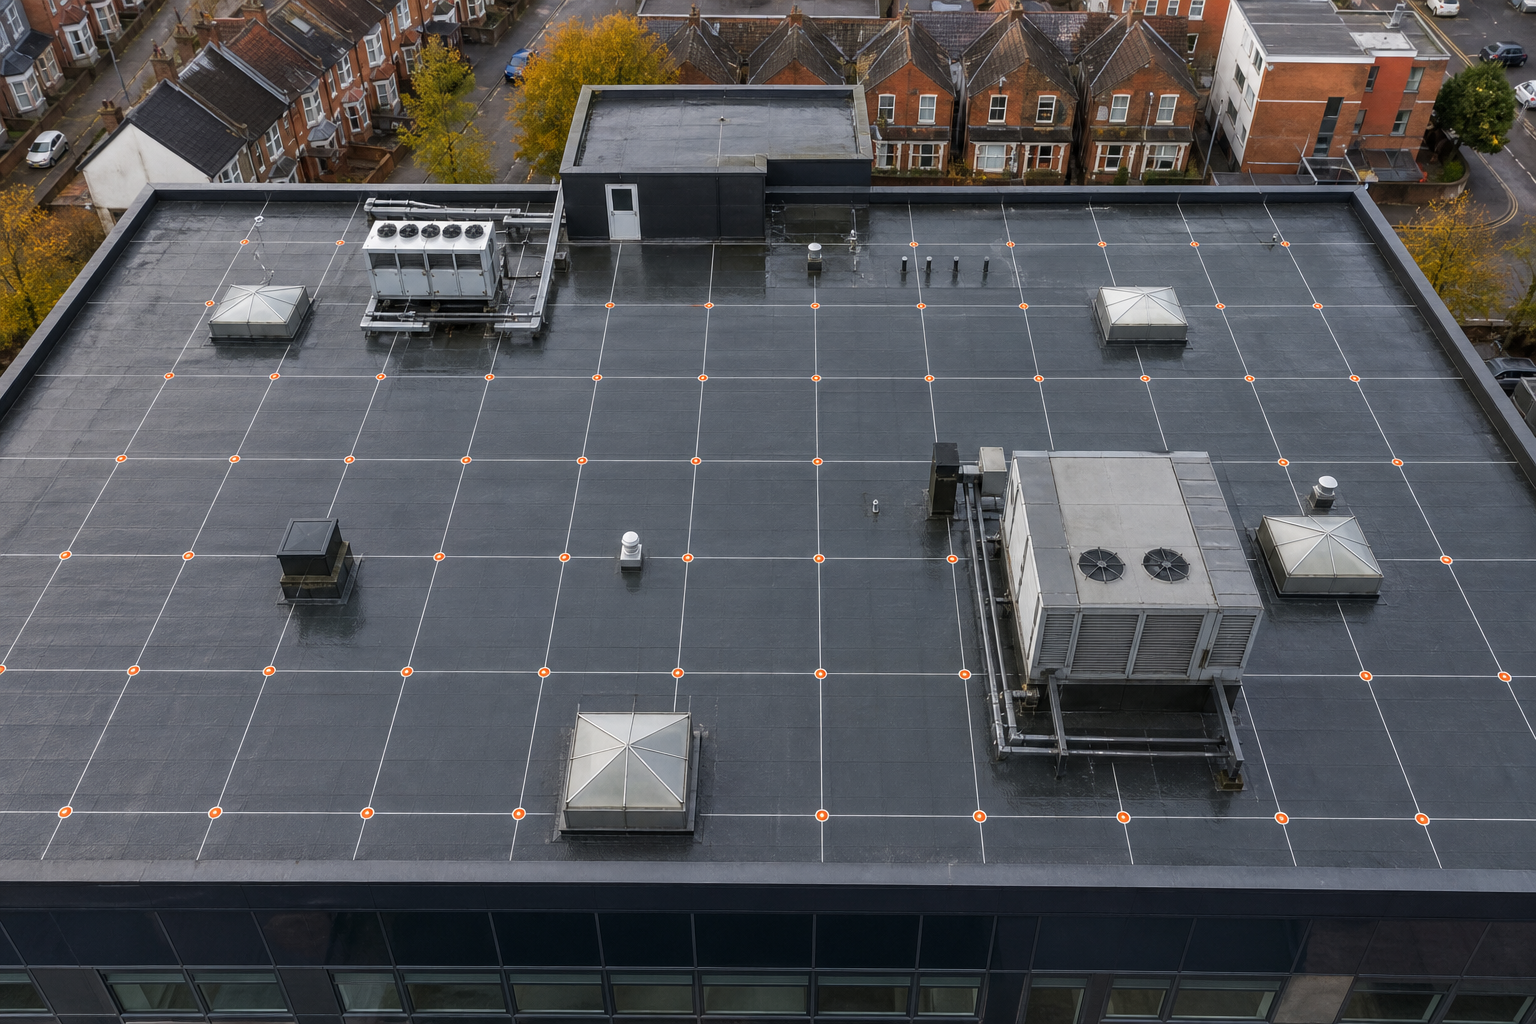
Leaking roofs can hide costly damage until it shows up inside a building. A roof moisture survey maps that hidden water so you can fix the right spot, not guess.
Below is a usable walkthrough that takes you from planning the grid to delivering a clear report.
Step 1: Plan the Survey Grid and Weather Conditions
First, decide how dense your grid needs to be. A 6‑foot (≈1.8 m) spacing works well for most UK flat roofs , it gives enough data points without creating excess overlap. Mark the grid on a printable plan or load it into a tablet app.
Next, check the weather. The ideal window is a clear, sunny day followed by a calm evening when the roof cools. Wind under 10 mph and ambient temperature between 10 °C and 25 °C keep thermal contrast strong. If rain has fallen within the last 24 hours, wait for the surface to dry; moisture on the membrane will mask the readings you need.
Desktop research also matters. Pull the building’s as‑built drawings, note any penetrations, and flag areas where drainage has historically struggled. This background lets you focus the grid on high‑risk zones including rooflights, parapet walls, and PV array mounts.
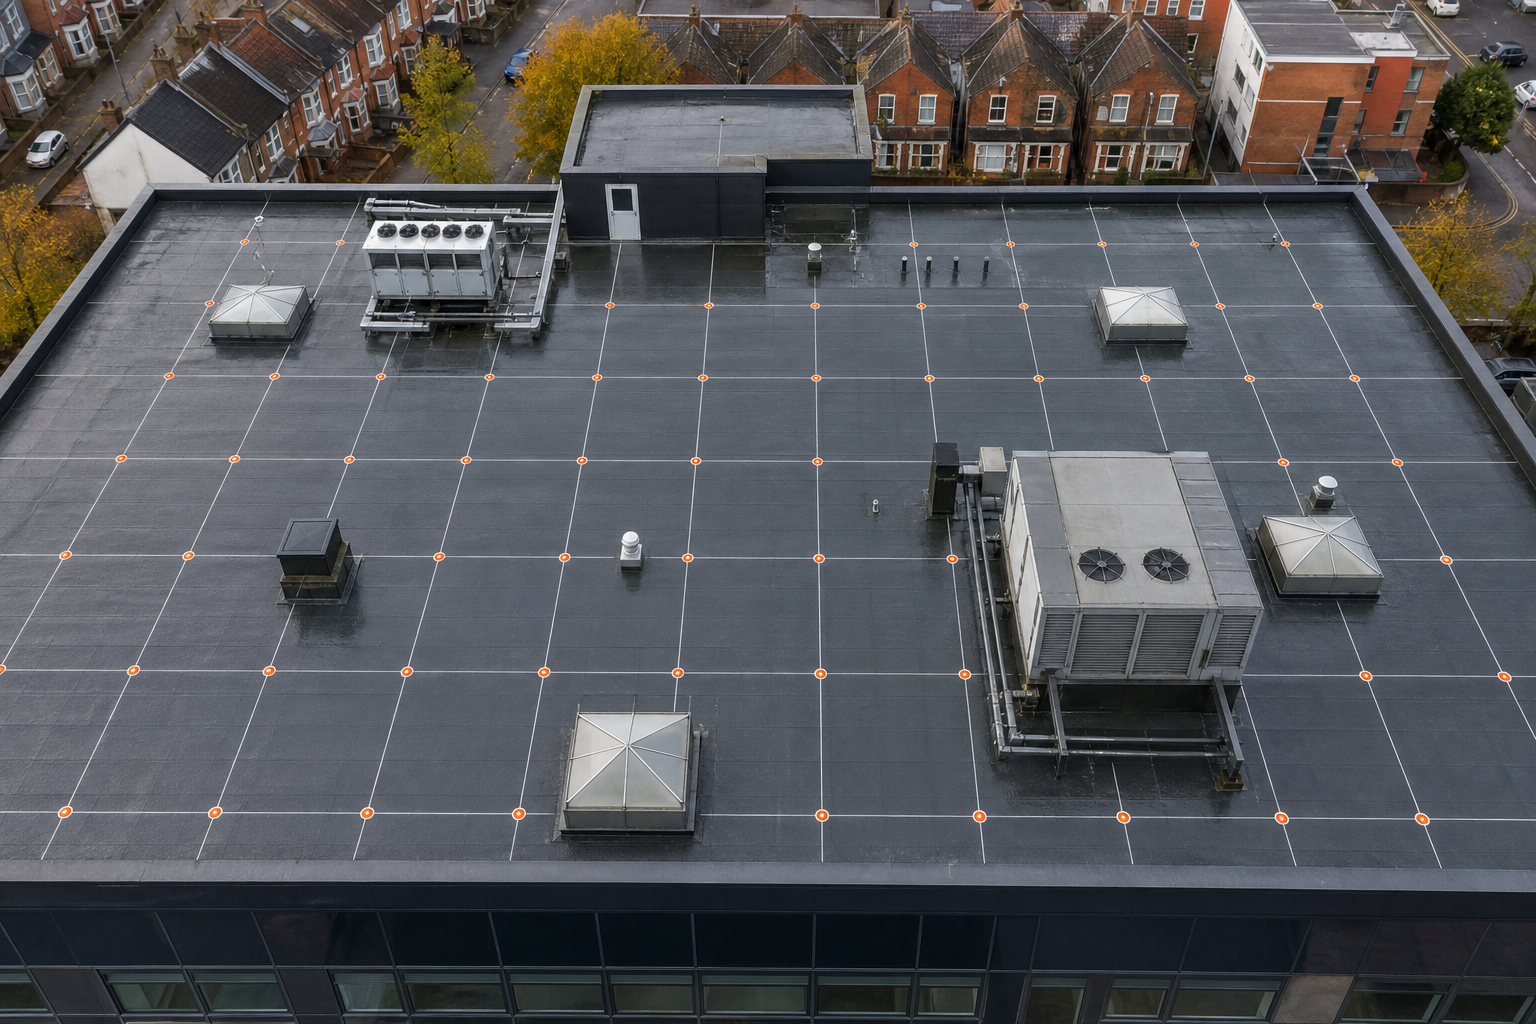
When the grid is set, record the reference points , a corner of the roof, a fixed ladder, or a permanent vent , so you can stitch the thermal images later. The reference also helps anyone reviewing the report to understand exactly where each reading originated.
We often start with a quick visual walk‑over to note obvious defects , cracked seams, ponding water, or debris. Those notes become layers on the digital plan, giving context to the thermal data you’ll capture.
By now you should have a clear grid, a weather window, and a list of high‑risk features ready for the next step.
Step 2: Choose and Calibrate Measurement Technology
The heart of a modern survey is a drone equipped with a radiometric thermal camera. The camera must be calibrated on‑site using a known‑temperature reference plate , a flat metal sheet that you let sit in the shade for five minutes. This step removes sensor drift and guarantees accurate temperature readings.
When selecting a camera, look for a NETD (noise‑equivalent temperature difference) below 50 mK and a resolution of at least 160 × 120 px. Those specs let you spot temperature differences of a few tenths of a degree, which is what separates a wet insulation patch from a dry one.
We also back‑up the drone with a handheld capacitance meter like the Tramex DecScanner. It pushes a low‑frequency signal through the roof build‑up and measures impedance changes that indicate moisture depth up to 150 mm. The meter needs a dry baseline reading, so pick a roof area you know is dry and record its value before moving on.
Before the first flight, run a short test pass at low altitude. Compare the live thermal feed with the reference plate temperature. If the values differ by more than 0.5 °C, adjust the camera’s emissivity setting , most roofing materials sit around 0.9, but metal flashing needs a lower value.
For the capacitance scanner, set the range to the expected moisture level (usually 0‑100 % for insulation). Run a quick “dry” scan across a known‑dry zone to verify the meter reads near zero. That gives you confidence when you later encounter higher readings.
We rely on these two technologies together because the drone gives you full‑roof coverage, while the hand‑held meter pinpoints the exact depth of moisture in critical spots.
By now you have a calibrated drone, a calibrated handheld meter, and a clear plan for how they will work together.
Step 3: Execute On‑Site Data Collection
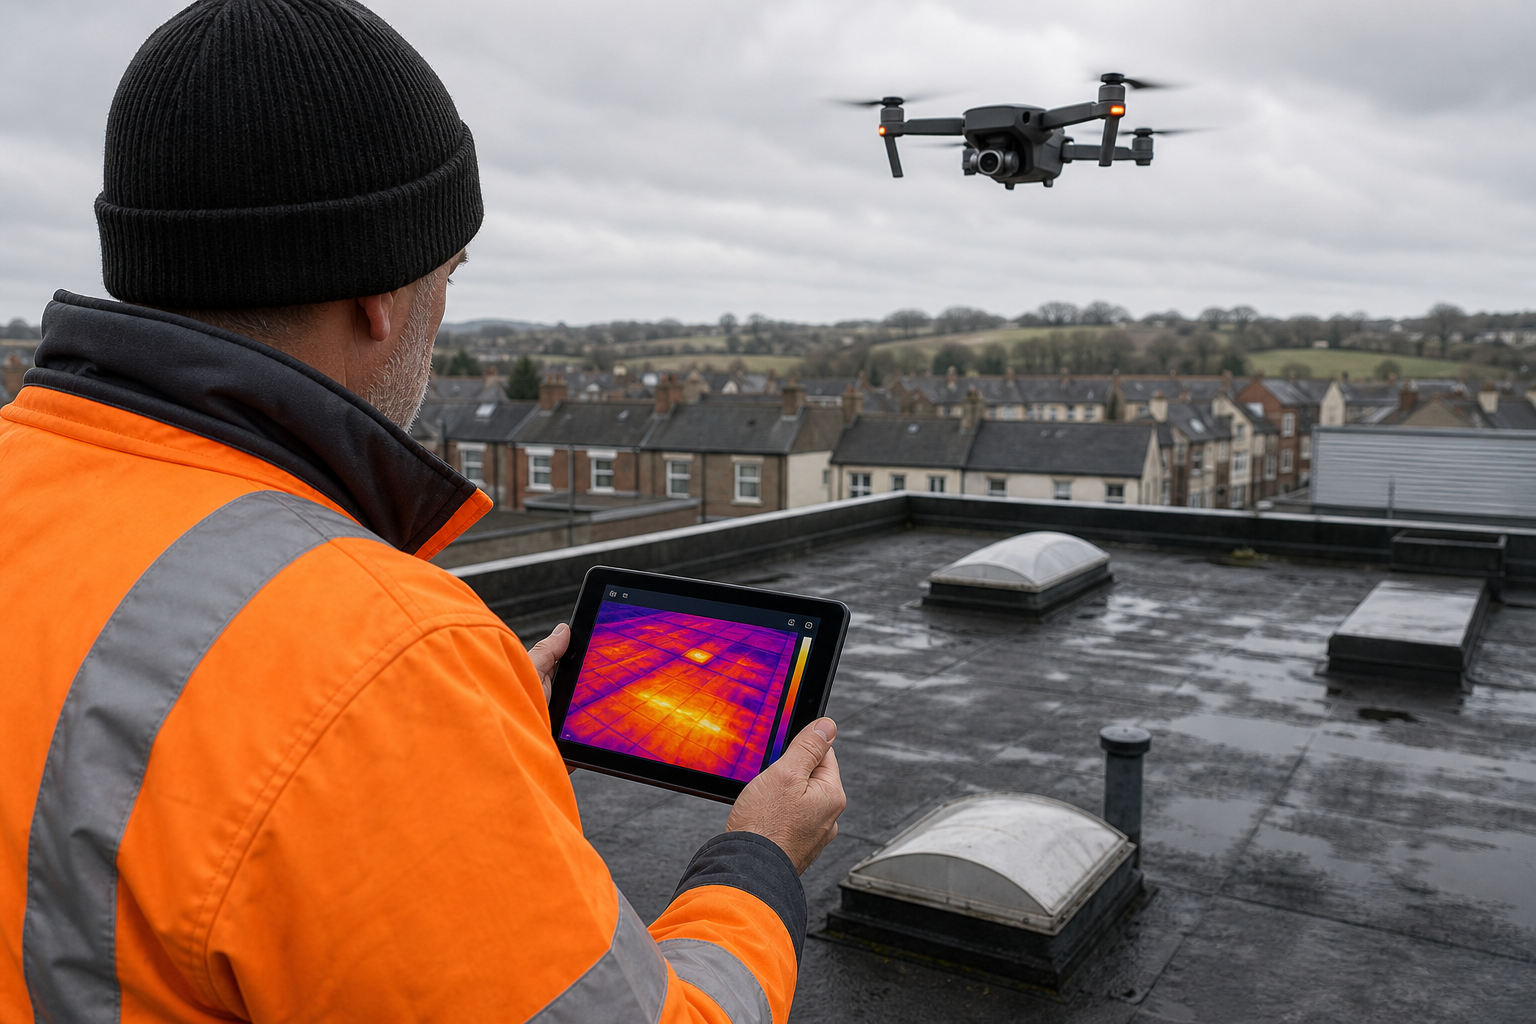
Launch the drone at the start of the agreed weather window , usually just after sunset when the roof has cooled. Set the flight controller to follow the grid you plotted earlier, with 70‑80 % front and side overlap. Overlap is key; it lets the photogrammetry software stitch the images into an accurate orthomosaic and aligns each thermal frame with its visual counterpart.
While the drone flies, a second technician walks the roof with the capacitance scanner, stopping at each grid node. Record the reading, the GPS coordinate, and a quick note on surface condition (e.g., “pitted membrane” or “heavy ballast”). If a reading exceeds the dry baseline by more than 10 % you flag that point for deeper investigation.
Keep the drone speed under 5 m/s to avoid motion blur in the thermal frames. After each flight leg, pause to download the images to a laptop and verify that no frames are missing. Spot‑checking a few thermal images against the reference plate temperature helps you catch any drift before the day ends.
When the drone has covered the entire roof, return to the ground and run a second pass with the handheld meter over any “hot spots” you saw in the thermal data. This double‑check confirms whether the thermal anomaly is truly moisture or just a sun‑warmed metal detail.
In practice you should have a complete set of geotagged thermal images, a spreadsheet of capacitance readings, and a field notebook with observations. All that raw data is ready for analysis.
Step 4: Analyse Results, Create Moisture Maps and Report
Import the thermal images into specialist analysis software. Align the thermal layer with the visual orthomosaic, then apply a temperature‑range filter that highlights areas warmer than the surrounding roof by at least 2 °C, a difference that usually signals wet insulation.
Overlay the capacitance data on the same map. Where the thermal map shows a warm patch and the scanner reads high moisture, you have a high‑confidence leak zone. Mark those points with a coloured icon and add a short note describing the suspected cause (e.g., “failed flash at vent pipe”).
Next, generate a moisture heat‑map that uses a gradient colour palette , blues for dry, reds for wet. Include a legend that explains the temperature delta and the corresponding moisture content. This visual makes it easy for facilities managers to see at a glance which sections need repair.
Write the report in three parts: (1) an executive summary that lists the top three priority zones, (2) a detailed findings section that shows each map, the raw data table, and the recommended action, and (3) an appendix with the raw files, calibration certificates, and flight log. The appendix satisfies compliance standards including IEC 62446 and BS 6229, which many public‑sector clients require.
We often include a short “next‑steps” checklist: confirm the breach with a core sample, dry the area, repair the membrane, then schedule a follow‑up thermal scan after a month to verify the fix.
By now you have a complete, evidence‑based picture of roof moisture, ready to be handed to the client or the asset‑management team.
FAQ
What is a roof moisture survey?
A roof moisture survey maps hidden water in a roof build‑up using thermal imaging and point‑based moisture meters, giving you a visual and numeric picture of where moisture is present.
How often should a commercial flat roof be surveyed?
Most asset‑management plans call for a survey every 3‑5 years, or sooner if you notice interior stains, rising energy bills, or recent heavy rain events.
Can I rely on thermal imaging alone?
No. Thermal images show temperature differences, but a handheld capacitance or nuclear gauge confirms the actual moisture depth and helps avoid false positives caused by sun‑heated materials.
What weather conditions give the best thermal results?
Clear skies, low wind (<10 mph), and a temperature swing of at least 5 °C between day and night produce the strongest thermal contrast for detecting wet insulation.
Do I need special certification to run a drone roof survey?
In the UK you must hold a CAA‑approved Permission for Commercial Operations (PfCO) and follow the relevant health‑and‑safety guidelines for working at height.
How does a moisture survey help with decarbonisation?
By pinpointing wet insulation, the survey lets you repair only the affected zones, preserving the rest of the roof’s thermal performance and avoiding unnecessary material waste.
For a deeper look at drone‑based roof inspections, check out our Drone Roof Survey: A Guide for Commercial Properties. If you need a step‑by‑step walkthrough of thermal imaging set‑up, our Thermal Imaging Moisture Detection guide walks you through camera selection and calibration. Finally, learn how to structure the final report in the Drone Roof Inspection Report guide.
For more technical background on infrared thermography, see Wikipedia’s infrared thermography entry. Industry bodies outline best practices for roof infrared inspections. British Standards for building envelope moisture control provide guidance on moisture management.
Ready to start your own survey? Download our free checklist, schedule a site visit, and let us help you turn hidden moisture into a clear plan of action.
Ready to put this into practice? Visual Perspectives Limited was built for exactly this.