Getting a clear picture of a roof’s health used to mean climbing ladders and hoping for good weather. Today a drone can capture the whole story in minutes, and the data can be turned into a solid roof condition report. Follow these five steps and you’ll have a report that lets you act fast and spend wisely.
Step 1: Plan the Survey Scope and Logistics
Start by writing a brief that spells out the main question you need answered, for example a roof condition survey. Is it a routine maintenance check, a leak hunt, or a pre‑solar‑panel audit? Adding any secondary questions helps the pilot know what to look for.
Walk the site before the flight. Note roof type, access routes, nearby obstacles like antennas or power lines, and any heritage restrictions. Record the building’s address, the areas you want covered, and the weather window you prefer. Noting the roof’s age, material, and any recent repairs helps shape the flight plan.
Choose a date when the temperature contrast will highlight moisture. Late afternoon or just after sunset works well for thermal scans because wet insulation stays warmer longer than dry sections. Make sure you have written permission from the property owner and that the site complies with CAA rules for unmanned aircraft.
Finally, decide what data you need. A visual orthomosaic, a thermal heat map, or both? Knowing the deliverables up front avoids extra flights later. By now you should have a clear brief, a safe access plan, and a list of required deliverables.
Step 2: Conduct the Drone Thermal Inspection
Load the flight plan into a mapping app that supports automatic grid flights. Set the altitude to 30‑50 m for flat commercial roofs and 40‑60 m for pitched roofs. Overlap should be around 70 % forward and 80 % side to give the software enough images to stitch together.
The drone carries two sensors: a high‑resolution RGB camera and a thermal camera. The thermal sensor records temperature values for each pixel, so you can later measure how hot a spot really is. Make sure the thermal camera is calibrated on a known temperature surface before take‑off , many pilots use a chilled metal plate for that.
During the flight, keep an eye on the live video feed. If the drone drifts near a chimney or a skylight, the obstacle‑avoidance system will pause the flight, protecting both the aircraft and the roof. Capture both visual and thermal frames at the same GPS coordinate; that pairing makes later analysis much easier.
When the drone lands, download the raw files immediately. Verify that every image is sharp and that the GPS tags are intact. Any missing data means you’ll have to schedule a follow‑up flight, which costs time and money.
Step 3: Analyse Thermal Data and Identify Defects
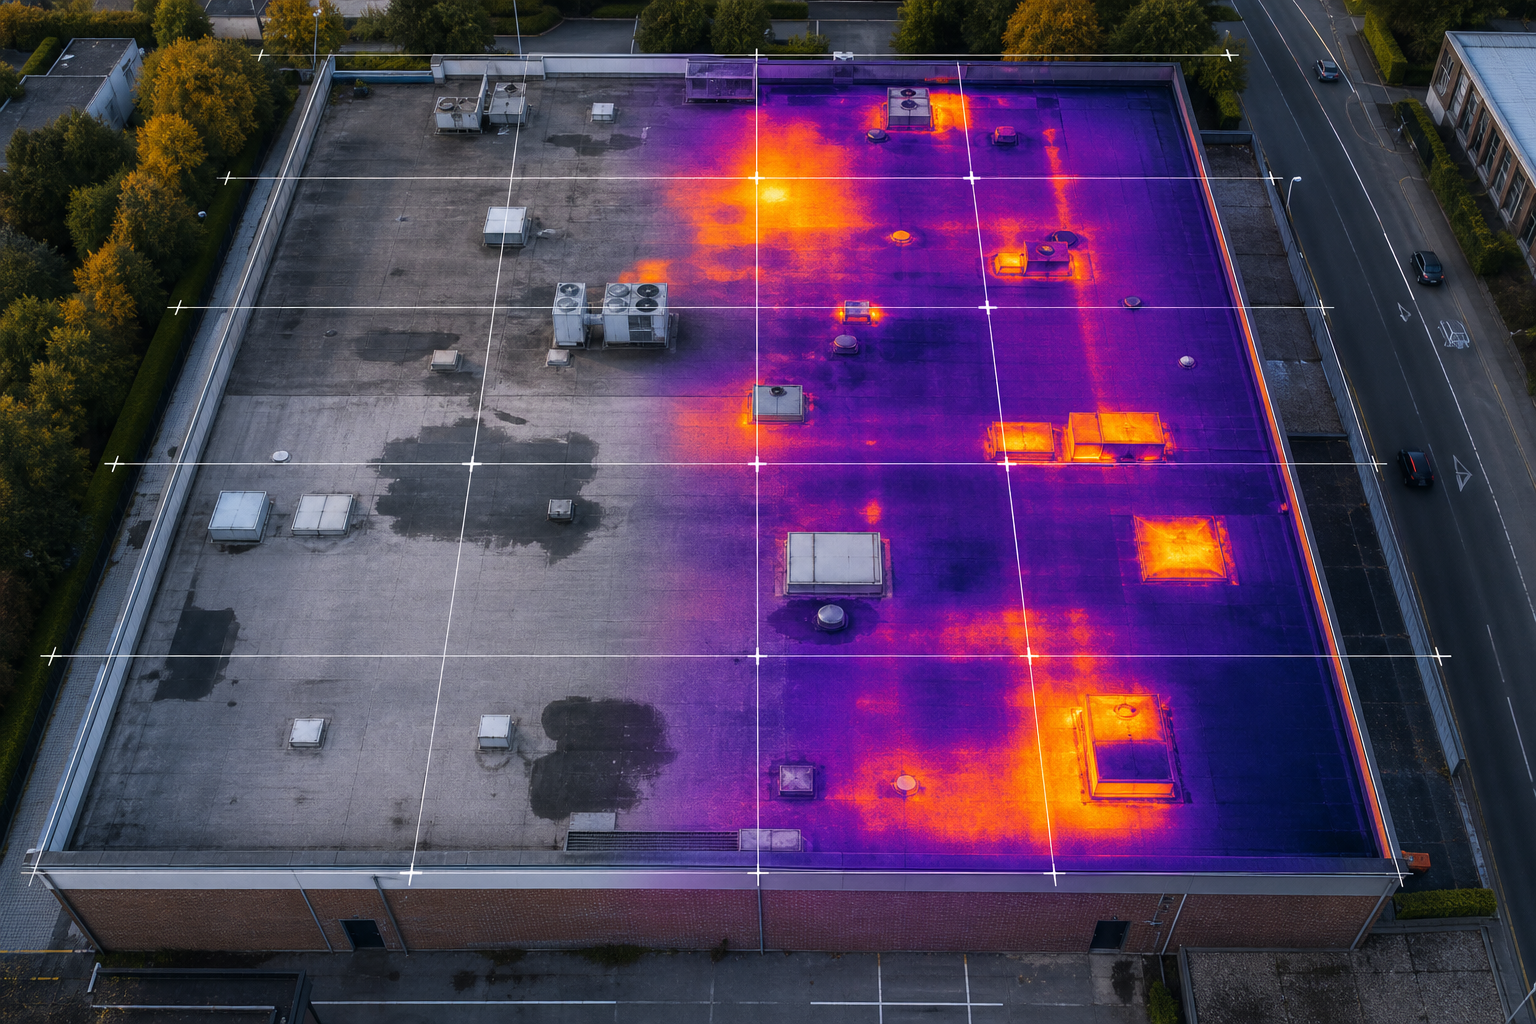
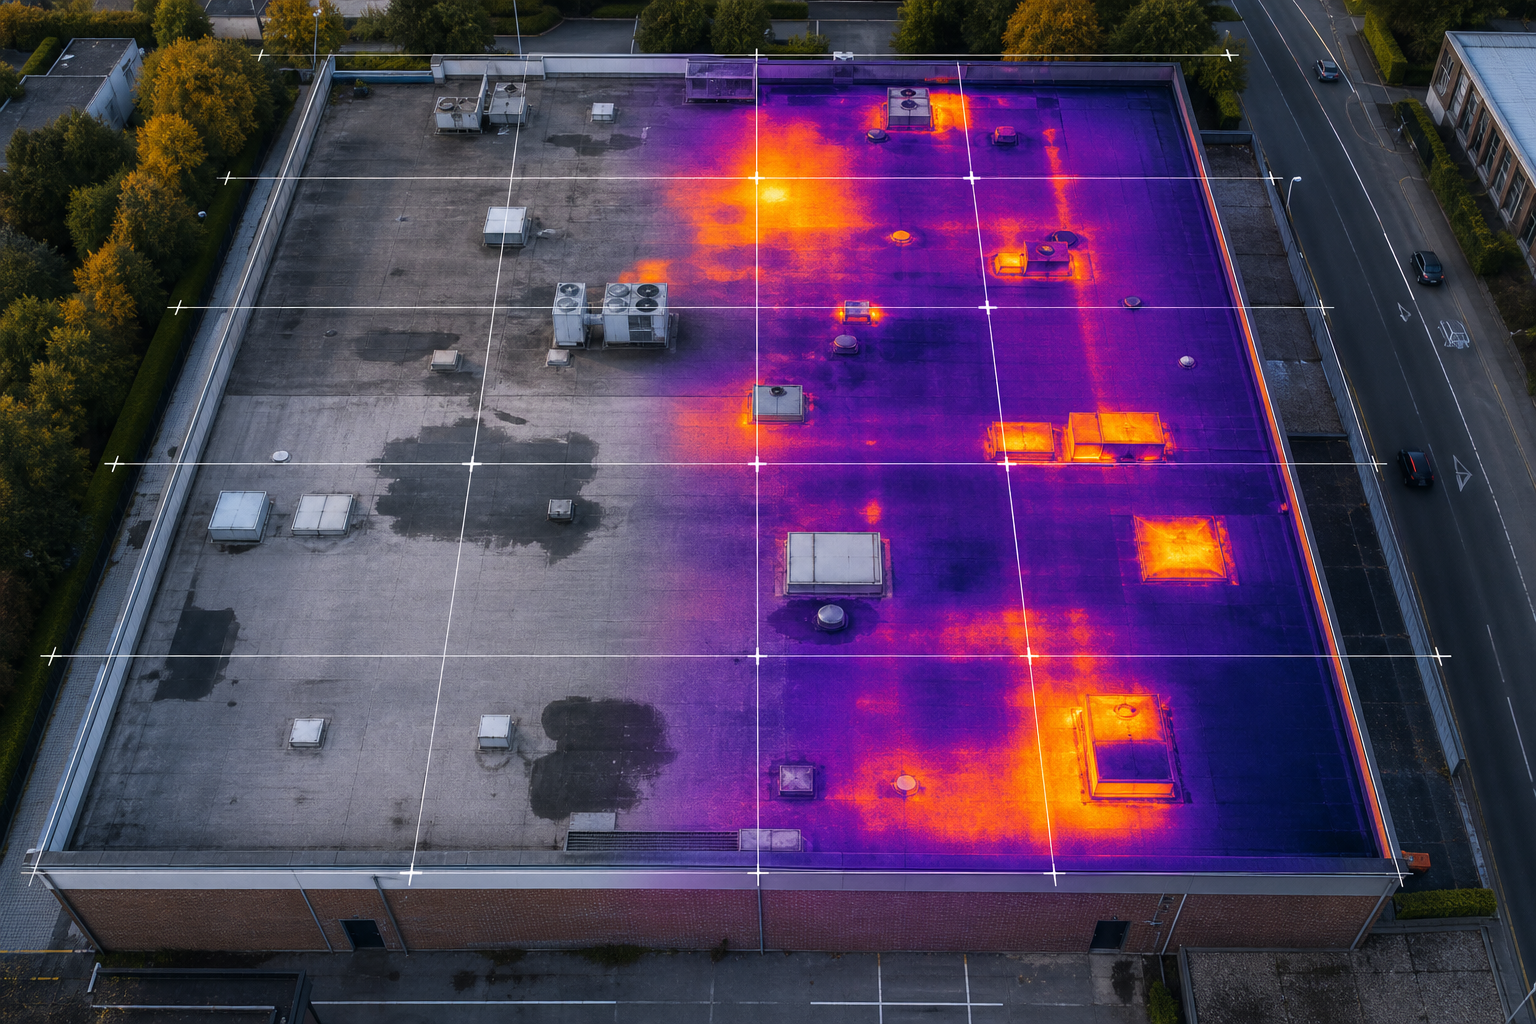
Load the thermal files into suitable thermal analysis software. Set the temperature scale so that the normal roof surface sits in the middle of the palette. Warm anomalies will stand out as bright reds or oranges.
For flat roofs, look for hot spots that match the pattern of trapped moisture. Wet insulation cools more slowly than dry material, so it appears warmer after sunset. Compare each thermal frame to its visual counterpart; a hot spot with no visible damage likely points to hidden moisture.
On pitched roofs, pay attention to roof‑edge junctions, rooflights, and any penetrations. Thermal bridges at these points show up as linear warm lines, indicating gaps in insulation or failing flashings.
Record each anomaly with its GPS coordinate, temperature delta (difference from surrounding area), and a brief description. Grade the severity: Priority 1 (immediate risk), Priority 2 (monitor within six months), or Priority 3 (no action needed now).
Cross‑check the findings against the building’s maintenance log. If a hot spot aligns with a known repair, it may simply be a lingering effect; a new spot, however, flags a fresh problem.
Step 4: Compile the Roof Condition Report
The raw data becomes useful only when it’s packaged in a clear, actionable document. Start with an executive summary that lists the inspection date, the drone model, the thermal sensor used, and the three most critical findings.
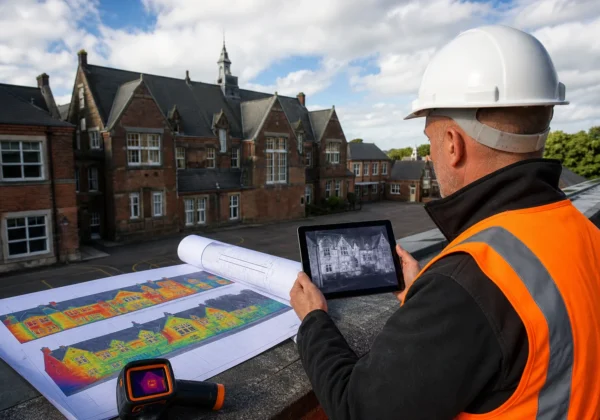
Next, add a site overview map. Use the orthomosaic to draw a simple roof plan and plot each defect’s GPS location. Pair every thermal hotspot with its visual photo , the side‑by‑side view lets anyone see what the temperature reading means on the actual surface.
Include a findings matrix. Columns should cover: ID, GPS coordinate, temperature delta, probable cause (e.g., moisture ingress, insulation gap, flashing failure), severity grade, and recommended action. This matrix lets asset managers sort and filter the data quickly.
End the report with a recommendations section. For each Priority 1 item, advise immediate remediation before any further work proceeds. For Priority 2, suggest a follow‑up inspection within six months. For Priority 3, note that monitoring at the next routine survey is sufficient.
Attach an appendix with the raw data files, calibration certificates, flight logs, and weather conditions at the time of capture. Those documents prove due diligence if the report is used for insurance or compliance purposes.
For more on how we structure our reports, see the Drone Roof Inspection Report: A Step‑by‑Step Guide. It walks through each section in detail.
Step 5: Apply the Report for Asset Management Decisions
Now the report sits on your asset‑management platform. Use the severity grades to feed a prioritisation score. The most common framework weighs condition (40 %), leak history (20 %), business impact (20 %), age (15 %), and warranty status (5 %). A roof scoring 80 % or higher should be funded this fiscal year.
Match each finding to a cost estimate. If a hot spot shows saturated membrane, budget for membrane replacement and any necessary re‑insulation. If the issue is a failing flashing, a targeted repair may suffice.
Track the findings over time. After a major storm, repeat the drone scan and compare the new temperature map to the previous one. Any new hot spots trigger an immediate review, while stable areas can stay on the routine monitoring schedule.
When the report supports an insurance claim, the appendix of raw data and flight logs provides the evidence insurers need to confirm the roof was in good condition before the event.
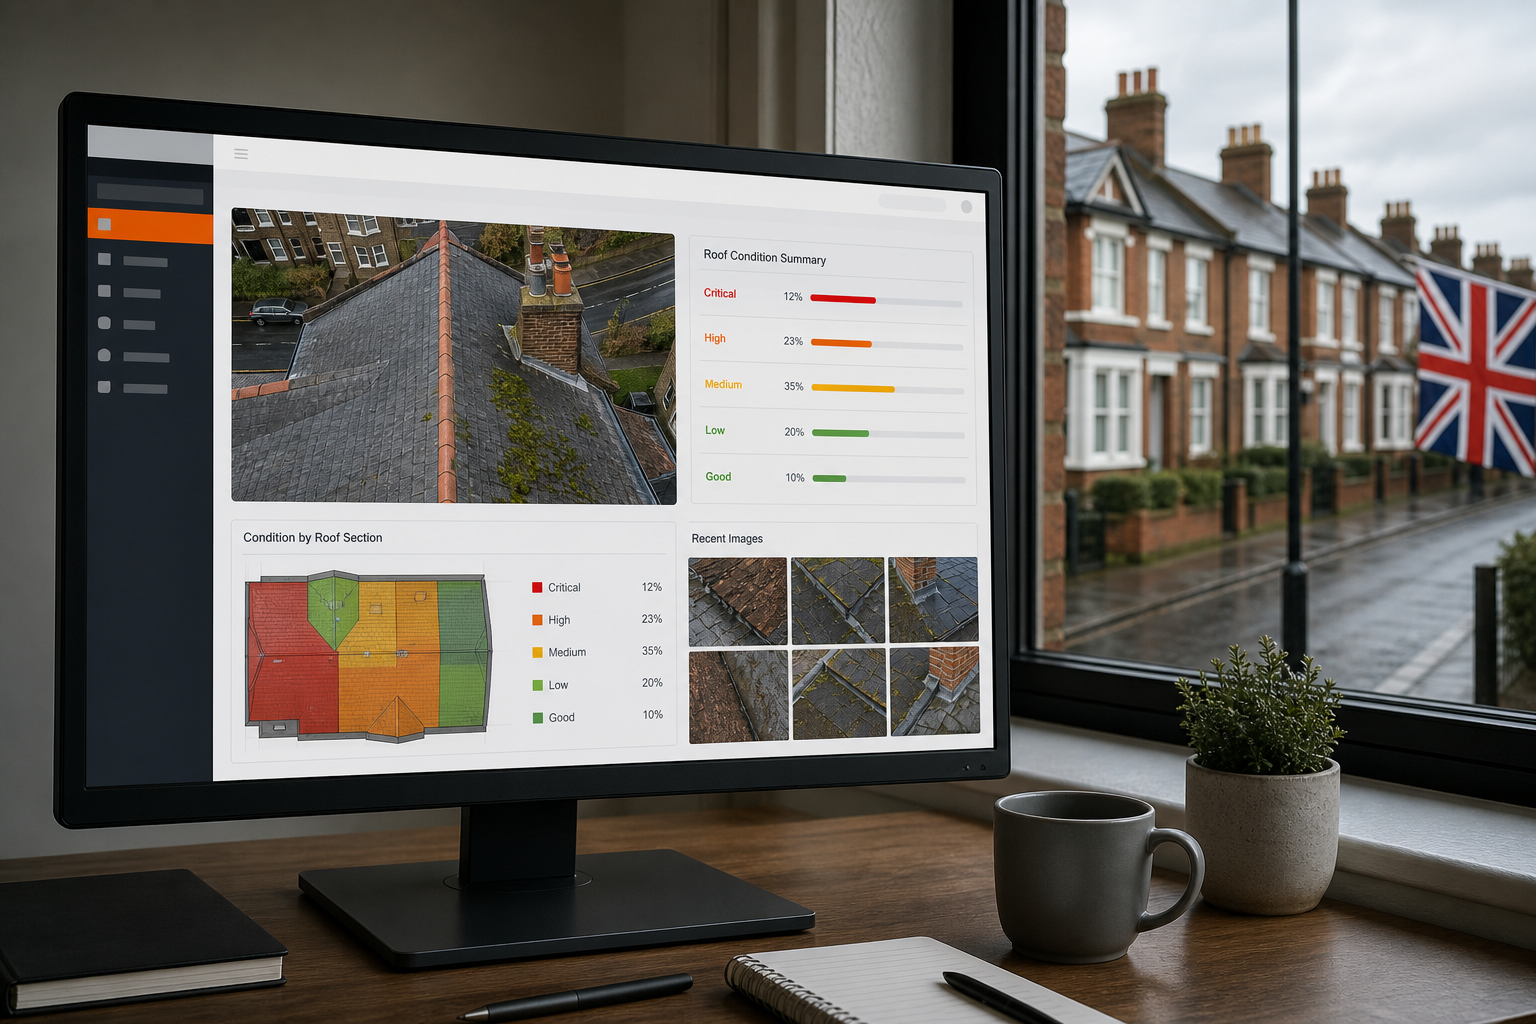
By turning thermal data into a scored priority list, you make capital‑allocation meetings less about gut feeling and more about hard evidence. That keeps budgets in check and extends the useful life of your roof stock.
FAQ
What equipment do I need for a drone roof condition report?
You need a CAA‑approved drone, a thermal imaging camera (at least 320×240 resolution), and software that can stitch images into an orthomosaic and tag GPS data.
How accurate are thermal readings for detecting moisture?
Thermal imaging can spot moisture that’s hidden from view because wet insulation stays warmer longer after sunset; accuracy improves when the temperature contrast between wet and dry areas exceeds 5 °C.
Can I do a roof condition report myself without a licensed pilot?
No, UK regulations require a licensed drone operator for commercial flights, and a qualified thermographer to interpret the thermal data reliably.
How long does it take to receive the final report?
Most projects deliver a complete roof condition report within five working days after the flight, assuming data quality checks pass on the first try.
What standards should the report follow?
For solar‑panel sites, the report must meet IEC 62446 requirements; for general roof surveys, it should reference BS 5534 for roof covering and Part L for energy performance where relevant.
How often should I repeat a drone roof inspection?
Annual inspections are a good baseline for most commercial roofs; increase the frequency after severe weather events or when the roof reaches 75 % of its design life.
Conclusion
Visual Perspectives Limited offers a proven, IEC 62446‑compliant service that handles every step from planning to reporting, so you can focus on fixing the roof, not chasing data. Ready to see what a professional drone‑based roof condition report looks like? Request a sample report through our website today.