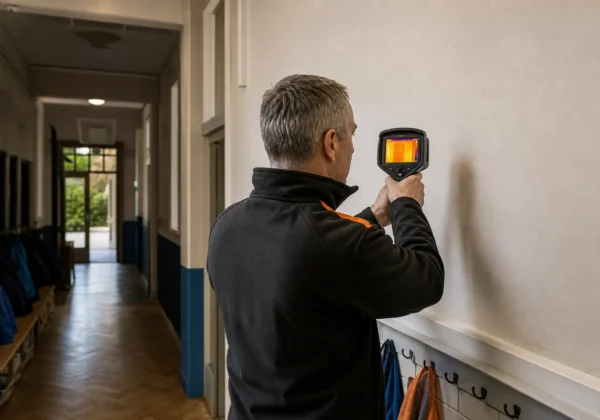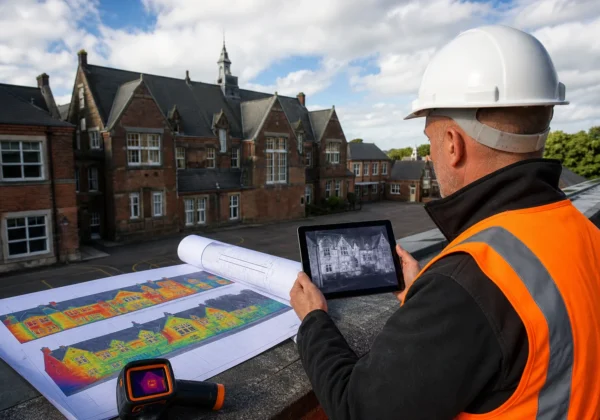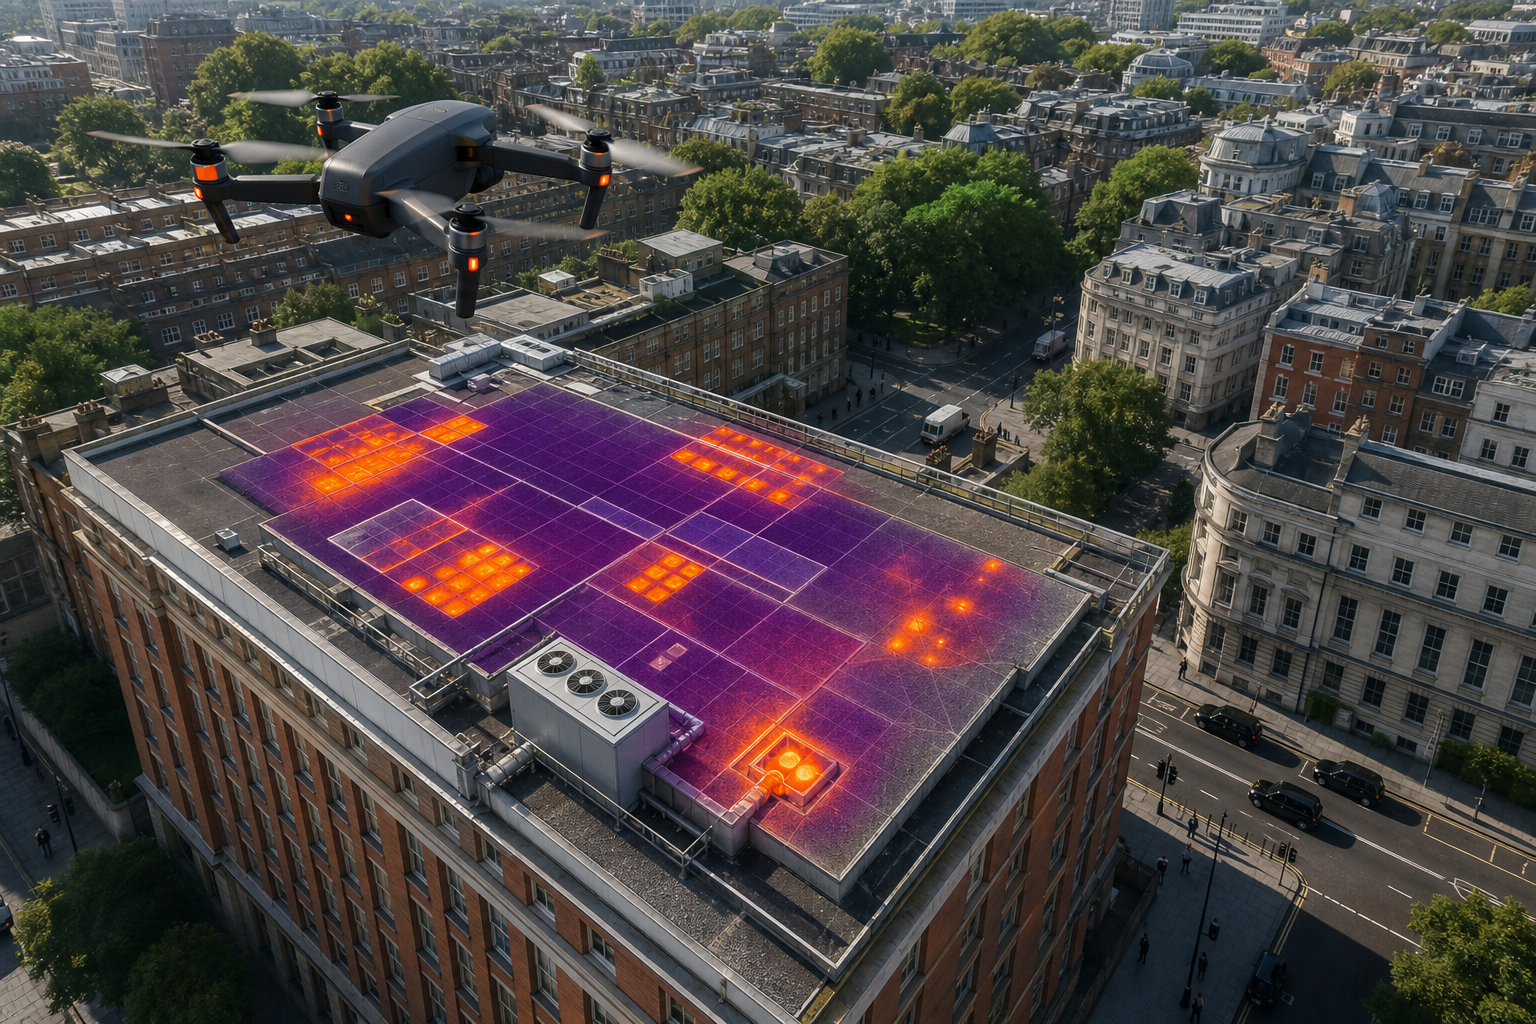
Need to spot hot spots in live electrical gear without shutting down power? Follow this usable walk‑through and you’ll get clean, compliant data every time.
Step 1: Define Survey Objectives and Safety Requirements
Start by writing down what you want to achieve. Is the goal to verify a new installation, to meet insurance conditions, or to catch early signs of overload? Clear objectives tell the thermographer where to focus and which standards to apply.
Next, map out the safety envelope. Identify who needs to be on site , a qualified electrician, a fire‑watch officer, or a health‑and‑safety supervisor. Make sure all parties have the right permits and that the site follows the UK electrical safety regulations. The survey must be run under normal load, so confirm that the circuits will stay energized throughout the scan.
Finally, decide how often the survey should repeat. High‑risk assets like switchgear or data‑centre UPS units usually need quarterly checks, while less critical panels can be inspected annually. Document the agreed frequency in a simple schedule so that maintenance teams can plan around it.
By now you should have a written brief that lists the purpose, the safety team, and the inspection cadence , a solid foundation for a smooth survey.
Step 2: Prepare Equipment – Drone, Thermal Camera and Calibration Tools
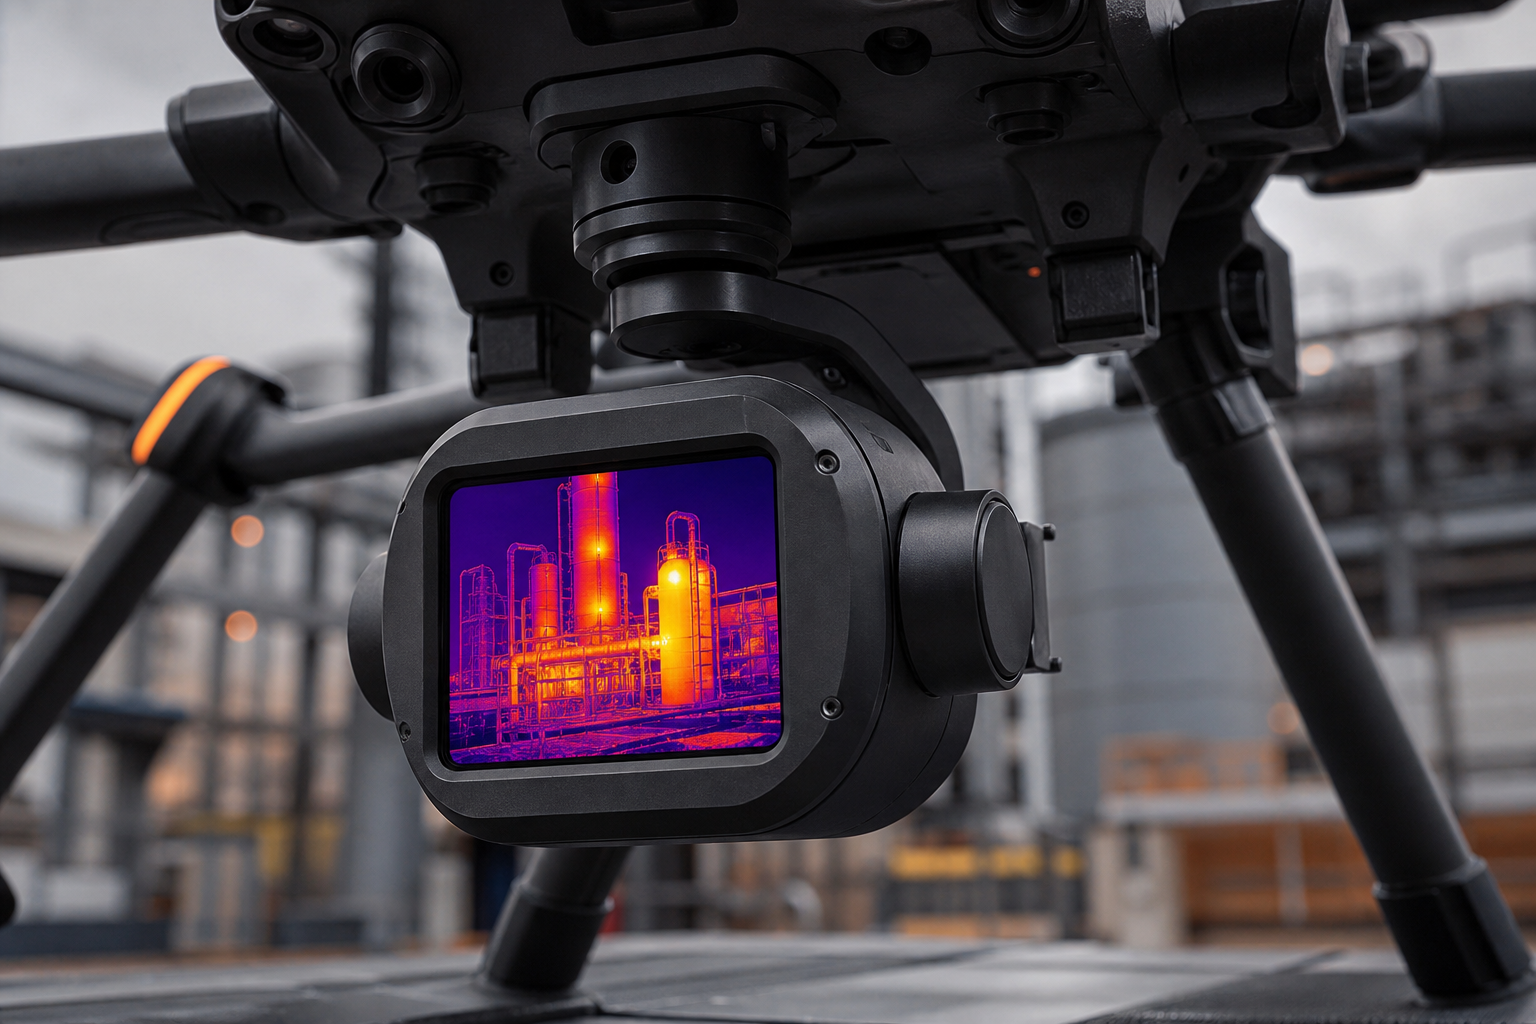
Choosing the right drone matters more than the camera itself. For building‑focused work, Visual Perspectives Limited often flies a DJI Matrice 4T or a similar platform that can carry a dual‑sensor payload. The drone should have enough lift to hold a thermal camera and a high‑resolution RGB sensor at the same time.
The thermal sensor needs to be calibrated before every field day. Calibration aligns the camera’s pixel response with known temperature points, usually by measuring a blackbody source in a lab. The calibration process checks image uniformity and then validates readings against several reference temperatures. A calibration certificate gives you confidence that the data you collect is accurate.
Don’t forget the ancillary gear: a handheld laser rangefinder for precise altitude checks, spare batteries, and a rugged tablet for live image preview. Pack everything in a waterproof case and run a quick pre‑flight checklist , battery charge, propeller condition, camera firmware, and GPS lock.
Once the drone, camera and calibration paperwork are ready, you can move on to the flight plan.
Step 3: Plan Flight Path and Data Capture Strategy
Good flight planning saves time and keeps the data clean. Begin with a site survey on the ground. Mark the edges of the roof, any skylights, and the location of major electrical panels. Use these points to create way‑points in your flight‑planning software.
Set the altitude so the ground‑sample‑distance (GSD) meets the required resolution , usually 5 cm / pixel for building diagnostics. Overlap is key: aim for 80 % front overlap and 70 % side overlap to avoid gaps in the thermal mosaic.
Weather matters too. The best thermal contrast appears when the building has been heated for several hours and the outside temperature is at least 10 °C lower. A clear sky and light wind keep the drone stable.
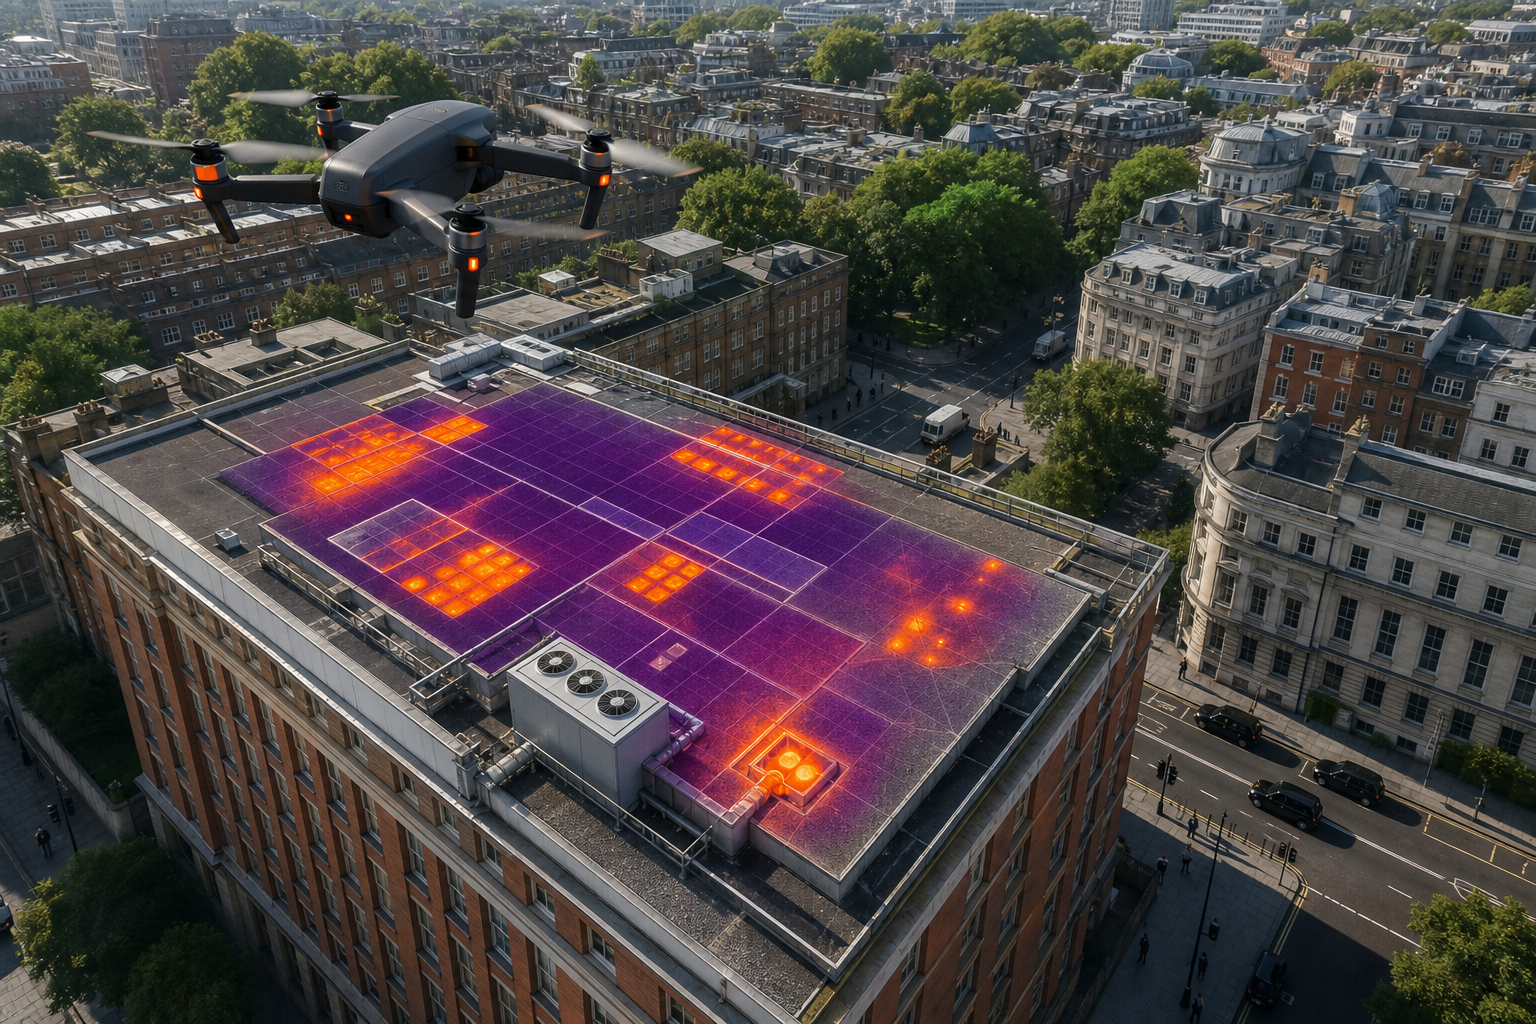
During the flight, capture thermal images first, then switch to RGB mode for a visual reference. Many modern drones allow simultaneous dual‑sensor capture, which cuts the mission time in half. Save each frame with its GPS tag , the software will later stitch them into a georeferenced thermal map.
By now you should have a flight plan file, a weather window, and a clear image‑capture order ready for the field.
Step 4: Execute the Survey – Capturing Accurate Thermal Data
On the day of the survey, arrive early to set up a safe landing zone. Conduct a brief safety talk with the crew, confirming who will hold the power isolation tags and who will monitor the drone’s flight path.
Launch the drone and let it follow the pre‑programmed way‑points. Keep an eye on the live thermal feed , if a hotspot appears outside the planned corridor, pause and add an extra pass to get a closer look. Remember that the camera’s temperature range should not be exceeded; most building‑grade thermal sensors work up to 400 °C.
After the drone lands, download the raw thermal files to the tablet and back them up to a secure server. Verify that each image has a proper GPS coordinate and that the exposure settings stayed consistent throughout the flight.
When the data check is complete, you can hand the files over to the analysis team. The field work is now finished and you have a full set of calibrated, geo‑referenced thermal images.
Step 5: Analyse Results, Identify Faults and Produce a Compliance Report
Load the thermal dataset into specialised software like FLIR Tools. Align the thermal layer with the RGB orthomosaic, this lets you see exactly where a hot spot sits on a piece of equipment.
Look for temperature differentials that break the normal pattern. For three‑phase equipment, a noticeable temperature difference between similar components can indicate issues such as loose contacts or overload.
Tag each anomaly with a severity rating , Priority 1 for immediate safety risk, Priority 2 for improved risk, and Priority 3 for monitoring. Write a concise description, note the load condition at the time of capture, and suggest a remedial action.
Finally, package the thermal imaging report with an executive summary, annotated images, and a compliance checklist that references IEC 62446 where solar‑PV panels are involved. Send the report to the client’s facilities manager and keep a copy for future baseline comparison.
Visual Perspectives Limited can help you turn these findings into a clear, insurer‑ready document that fits your maintenance schedule.
FAQ
What is an electrical thermal imaging survey?
An electrical thermal imaging survey uses an infrared camera to record heat patterns on live equipment, letting you see hot spots that indicate stress or impending failure.
Do I need to shut down power for the survey?
No. The survey is performed under normal load, which means the system stays energised and the data reflects real‑world operating conditions.
How often should a commercial building undergo an electrical thermal imaging survey?
High‑risk assets like switchgear or data‑centre UPS units are usually checked quarterly, while lower‑risk panels can be inspected once a year.
What qualifications should the survey provider have?
Look for a team that holds ITC Level 2 thermography certification, complies with IEC 62446, and carries sufficient liability insurance for electrical work.
Can the thermal data be used for insurance claims?
Yes. A detailed, calibrated report that follows recognised standards is often accepted by insurers as evidence of proactive risk management.
Conclusion
Follow these five steps and you’ll produce a reliable, compliant electrical thermal imaging survey that catches faults before they cause downtime. For a deeper look at building‑level thermography, explore our Thermal Imaging for Buildings guide. You’ll be in good hands.