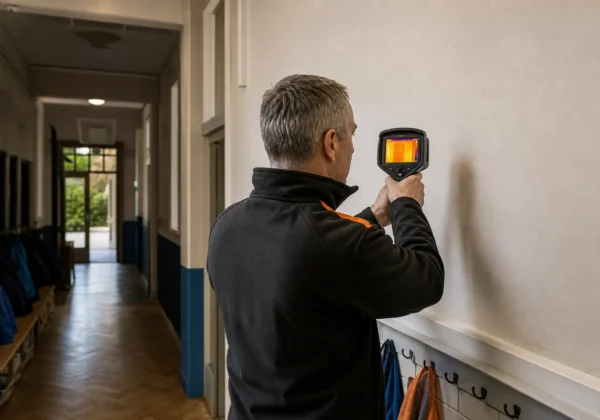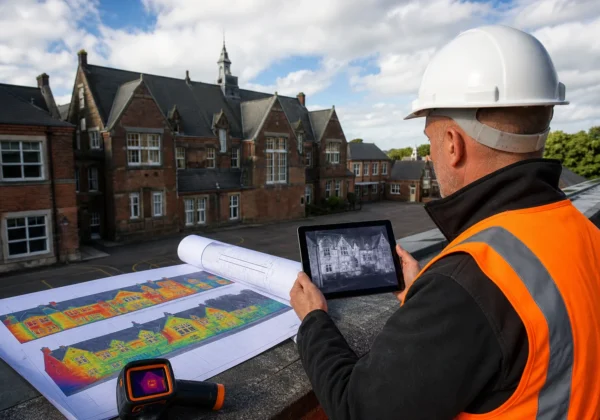
You’ve got a cold wall, a damp patch, or a roof that never feels dry. A thermal camera survey can turn that vague feeling into clear evidence. Follow these five steps and you’ll have a solid picture of where moisture is hiding, how to verify it, and what to do next.
Step 1: Define the Moisture Investigation Before Scanning
Start with a clear question. Are you checking a single roof membrane, a wall junction, or an entire estate? Write the question down , it keeps the survey focused and saves time later.
Next, gather any clues you already have. Tenant complaints, condensation patterns, or a history of roof leaks all point to hot spots you’ll want to watch.
We at Visual Perspectives Limited always ask the client for a brief brief of the building’s age, construction type and recent work. That lets our thermographers choose the right camera settings and plan the flight path.
Finally, decide what you need from the survey. A simple visual map for a budget‑friendly report, or a full IEC 62446‑compliant defect‑diagnostics package? The answer shapes the level of detail you’ll capture.
Need more detail on moisture‑detection basics? Thermal Imaging Moisture Detection: A How‑To Guide walks you through the physics behind the colour palette.
Step 2: Prepare the Building and Choose Suitable Survey Conditions
Thermal cameras need a temperature difference to spot wet areas. Aim for at least a 5 °C gap between interior and exterior. Turn the heating on 24 hours before the survey so the building fabric reaches a steady temperature.
Clear the area around external walls. Move furniture, take down heavy curtains and close all windows and doors. This lets the heat flow through the walls rather than being lost to drafts.
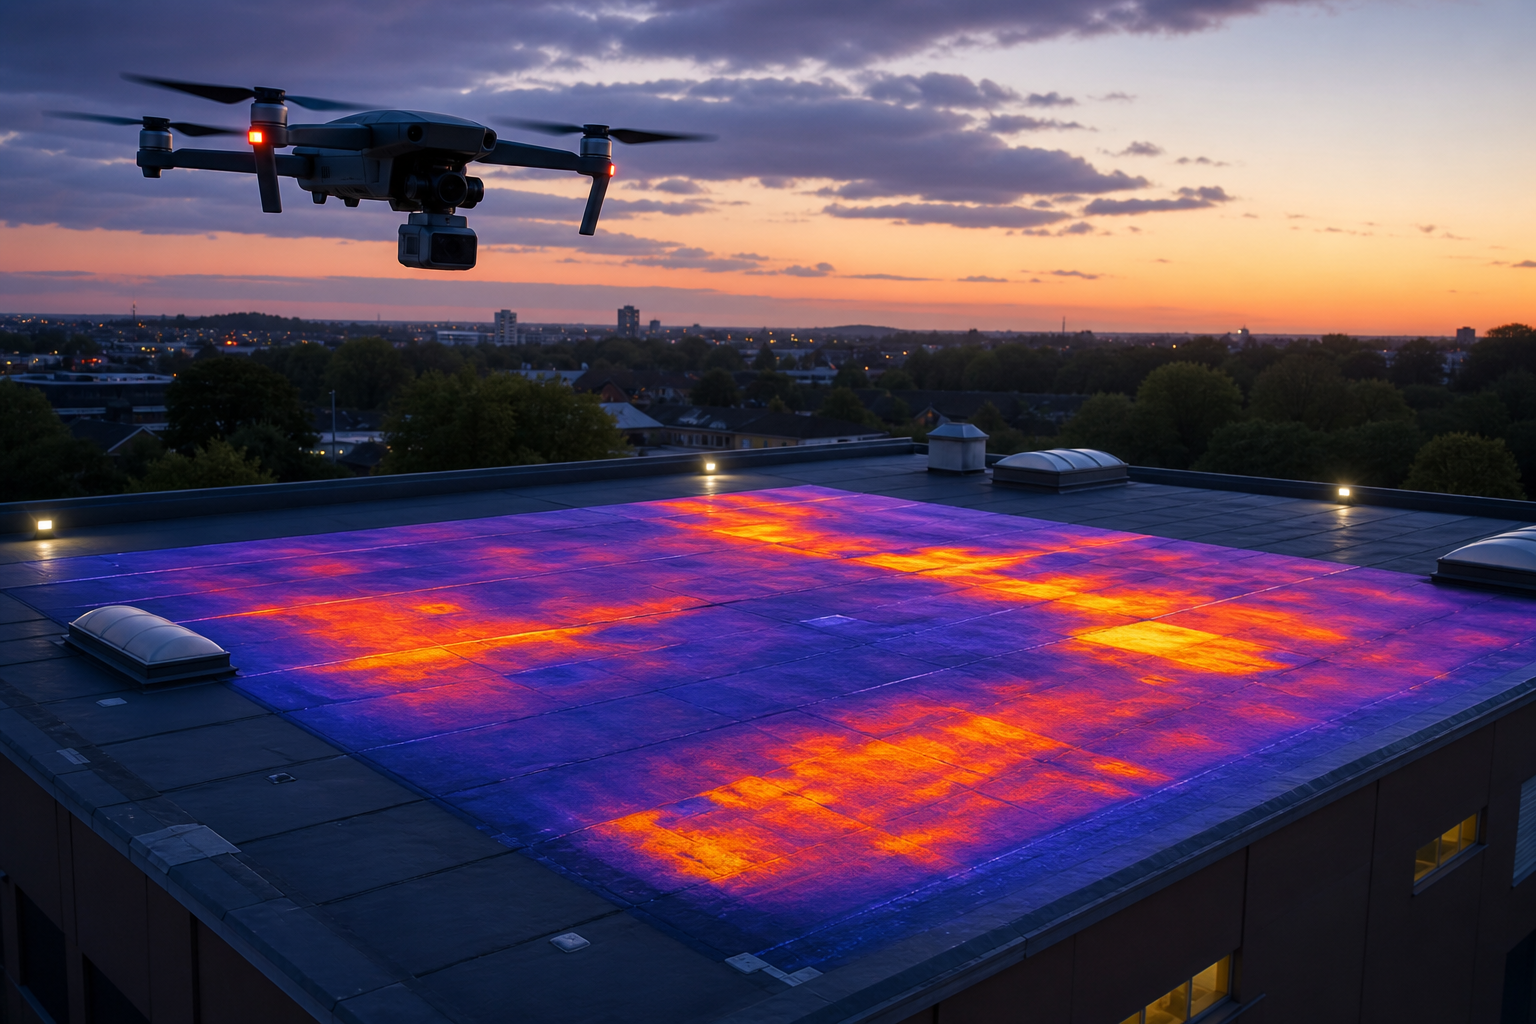
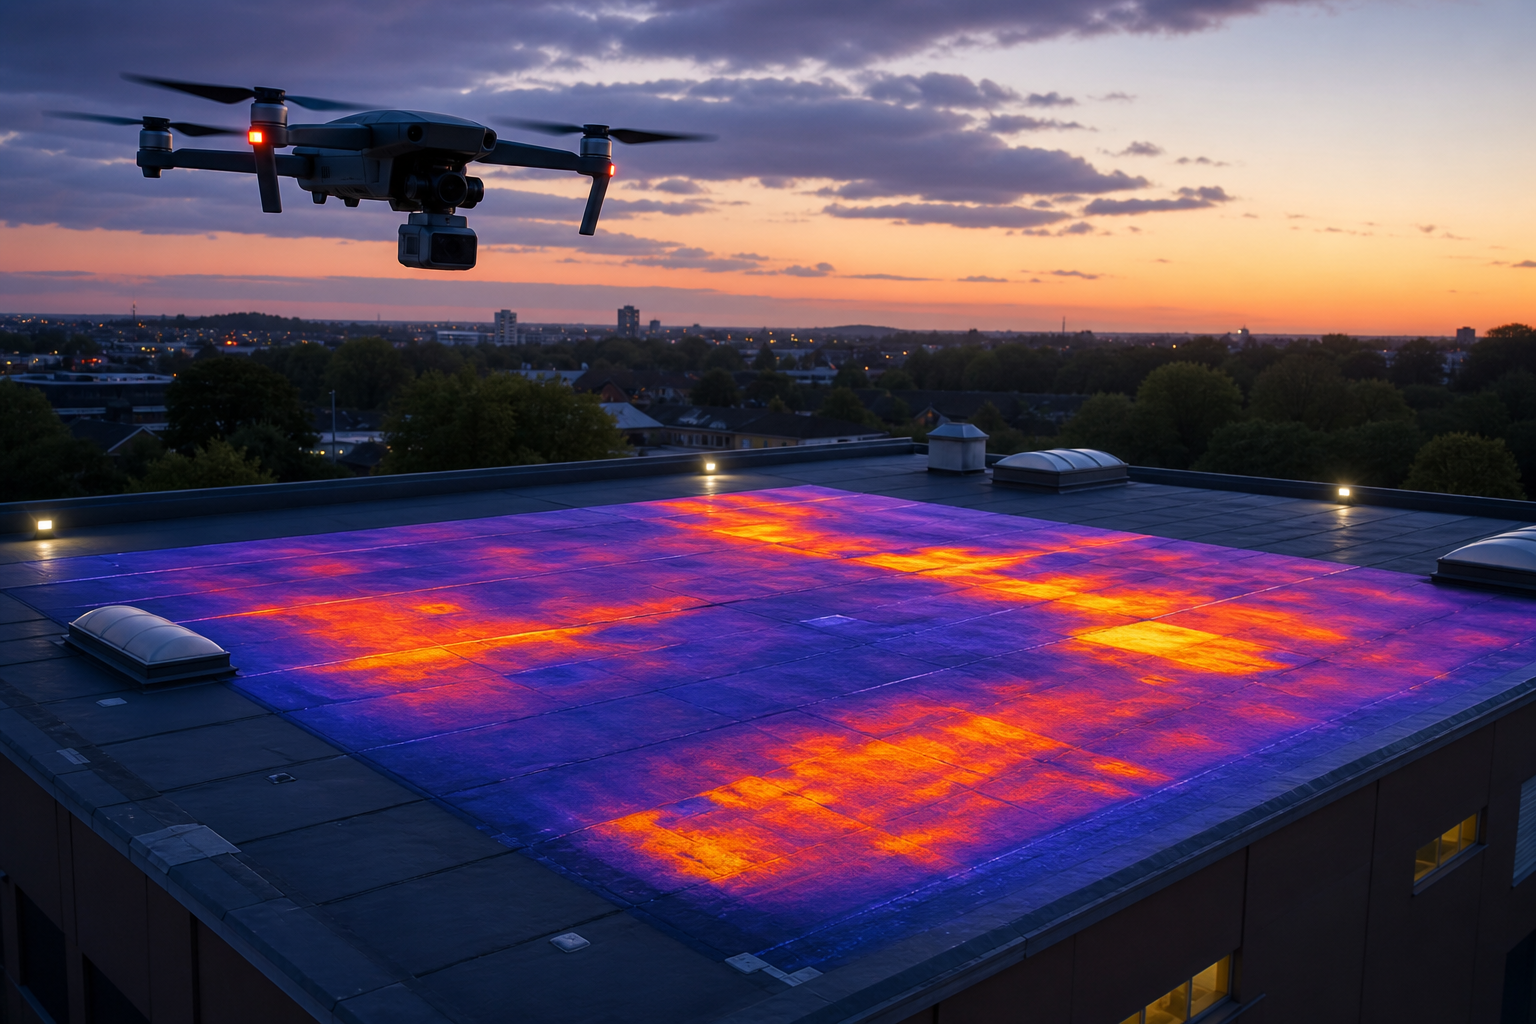
Check the weather. Wind under 5 m/s, no rain in the previous 24 hours and a clear sky are ideal. If you’re scanning a flat roof, schedule the flight just after sunset , the roof cools faster than any trapped moisture, which stays warm and shows up as a bright patch.
Our drones are CAA‑approved and our pilots hold Level 2 BINDT qualifications. That means we can fly safely in tight urban sites while keeping the camera stable enough for sub‑degree accuracy.
For the official UK guidance on temperature differentials, see the Part L building regulation which recommends a minimum 5 °C indoor‑outdoor delta for reliable thermography.
When you’re ready, book the slot. We’ll send a weather‑check checklist and a safety brief to the site team.
Step 3: Capture Thermal Images and Record Building Context
Launch the drone at the agreed altitude , typically 10 m above the roof for flat‑roof work, or 15, 20 m for pitched roofs. Keep the flight speed under 5 m/s to avoid motion blur.
First capture high‑resolution RGB images. They give you a visual reference for any cracks, debris or flashing details that may explain a thermal anomaly later.
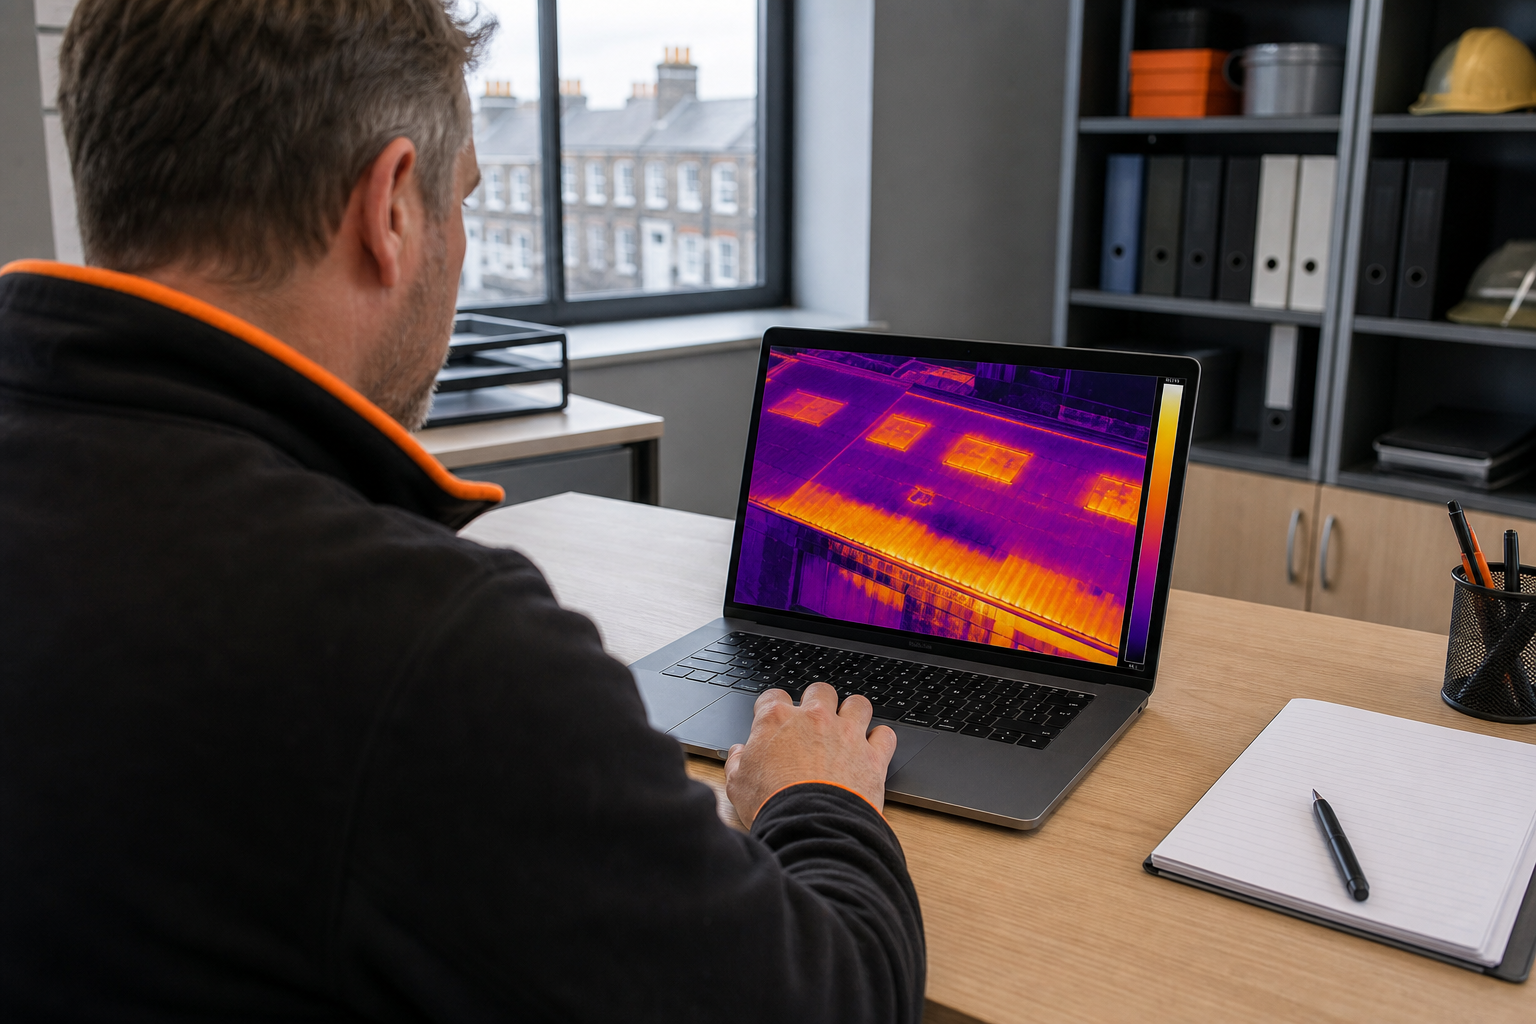
Then switch to thermal mode. Use a colour palette that highlights cold spots (blue‑purple) for moisture detection at night, or warm‑spot palettes (red‑orange) for daytime scans.
Fly a grid pattern with 70 % front overlap and 80 % side overlap. The overlap lets the stitching software build a smooth orthomosaic and a 3‑D model you can rotate.
While the drone circles, a thermographer watches the live feed and tags any hot or cold blobs that break the uniform gradient. Note the GPS location, the temperature delta from a nearby dry reference, and the time of capture.
After the flight, download the data to a secure portal. Our platform lets you compare the thermal map side‑by‑side with the RGB orthophoto , a quick way to see if a colour anomaly lines up with a visible defect.
Need a deeper look at roof‑level surveys? How to Conduct a Roof Moisture Survey shows how we plan waypoints for large commercial sites.
Step 4: Interpret Thermal Patterns Without Treating Them as Proof of Moisture
Thermal images are clues, not verdicts. A cold line that follows a wall‑joint often means a thermal bridge, not water. A warm blotch on a roof after sunset usually points to trapped moisture because wet insulation holds heat longer.
Use the building’s construction details to narrow possibilities. Solid‑wall houses, cavity‑wall constructions and flat‑roof membranes each have characteristic heat flows.
Cross‑check with ambient data. If the outside temperature is 12 °C and the interior is 20 °C, a 3 °C cold spot on an exterior wall could be a simple draft. The same spot on a roof that stays 6 °C warmer than the surrounding area after sunset is likely damp.
When you spot a suspect area, capture a reference image of a known dry zone. Later you can normalise the temperature scale against that baseline.
Remember: a thermal pattern only tells you where to look. You still need point‑measurements to confirm moisture.
Step 5: Confirm Findings, Report Risk and Plan Remedial Action
Take the hot or cold spots you marked and measure them with a non‑destructive moisture meter. Compare the reading to the dry reference , a reading above 20 % moisture content in wood, or above 5 % in plaster, usually signals a problem.
If the meter confirms moisture, document the exact location, the temperature delta, and the moisture percentage. Attach both the thermal image and the meter reading to the report.
Our report includes a heat‑map overlay, a risk rating (low, medium, high), and a clear set of remedial actions. For a high‑risk leak, we recommend immediate removal of saturated insulation and a waterproofing repair. For medium risk, schedule a drying programme and monitor with follow‑up scans.
When you hand the report to the building manager, include a short briefing video that walks through the key findings. That helps non‑technical stakeholders understand why a certain area needs urgent attention.
Visual Perspectives Limited can supply the full package, from drone capture to a signed defect‑diagnostics report. Our clients in NHS trusts and local authorities appreciate the clear documentation it provides.
Looking for more on how we turn data into action? How to Use Thermal Imaging for Roof Leaks explains the next steps after verification.
FAQ: Thermal Camera Surveys for Moisture
What does a thermal camera actually see?
A thermal camera records surface temperature differences, not the material behind the surface. It shows hotter or cooler areas as colours, giving you a clue where moisture may be changing the heat flow.
Do I need a drone for every survey?
No. Handheld cameras work for interior walls and low‑rise roofs. Drones are best for large or hard‑to‑reach roofs, because they capture consistent data without scaffolding.
How accurate are thermal readings for moisture detection?
Thermal imaging alone is not a measurement of water content. Accuracy comes from combining the image with point‑measurements from a calibrated moisture meter.
Can weather affect the survey?
Yes. High wind, rain or low temperature differentials can mask moisture signatures. We always schedule flights under calm, dry conditions with at least a 5 °C indoor‑outdoor gap.
Is the survey compliant with UK standards?
Compliance depends on the survey scope and applicable requirements.
How long does a full survey take?
From site briefing to final report, a typical commercial roof survey takes 1‑2 days for data capture and 3‑5 days for analysis and reporting.
Running a thermal camera survey for moisture gives you the evidence you need to fix problems before they cost more. Start by defining your investigation, prepare the building, capture quality data, interpret it carefully, and back up every hot spot with a moisture reading.Ready to see what the naked eye can’t?Download our free checklist and plan your next survey today.