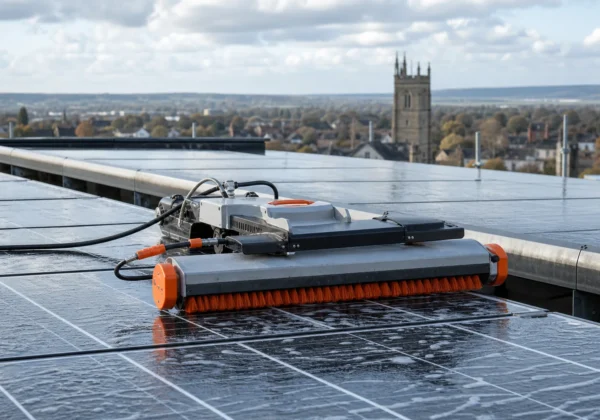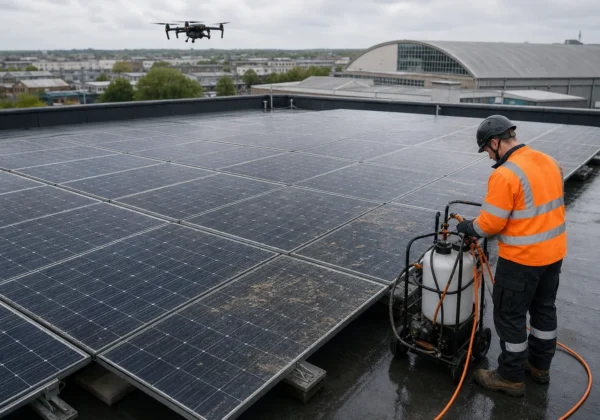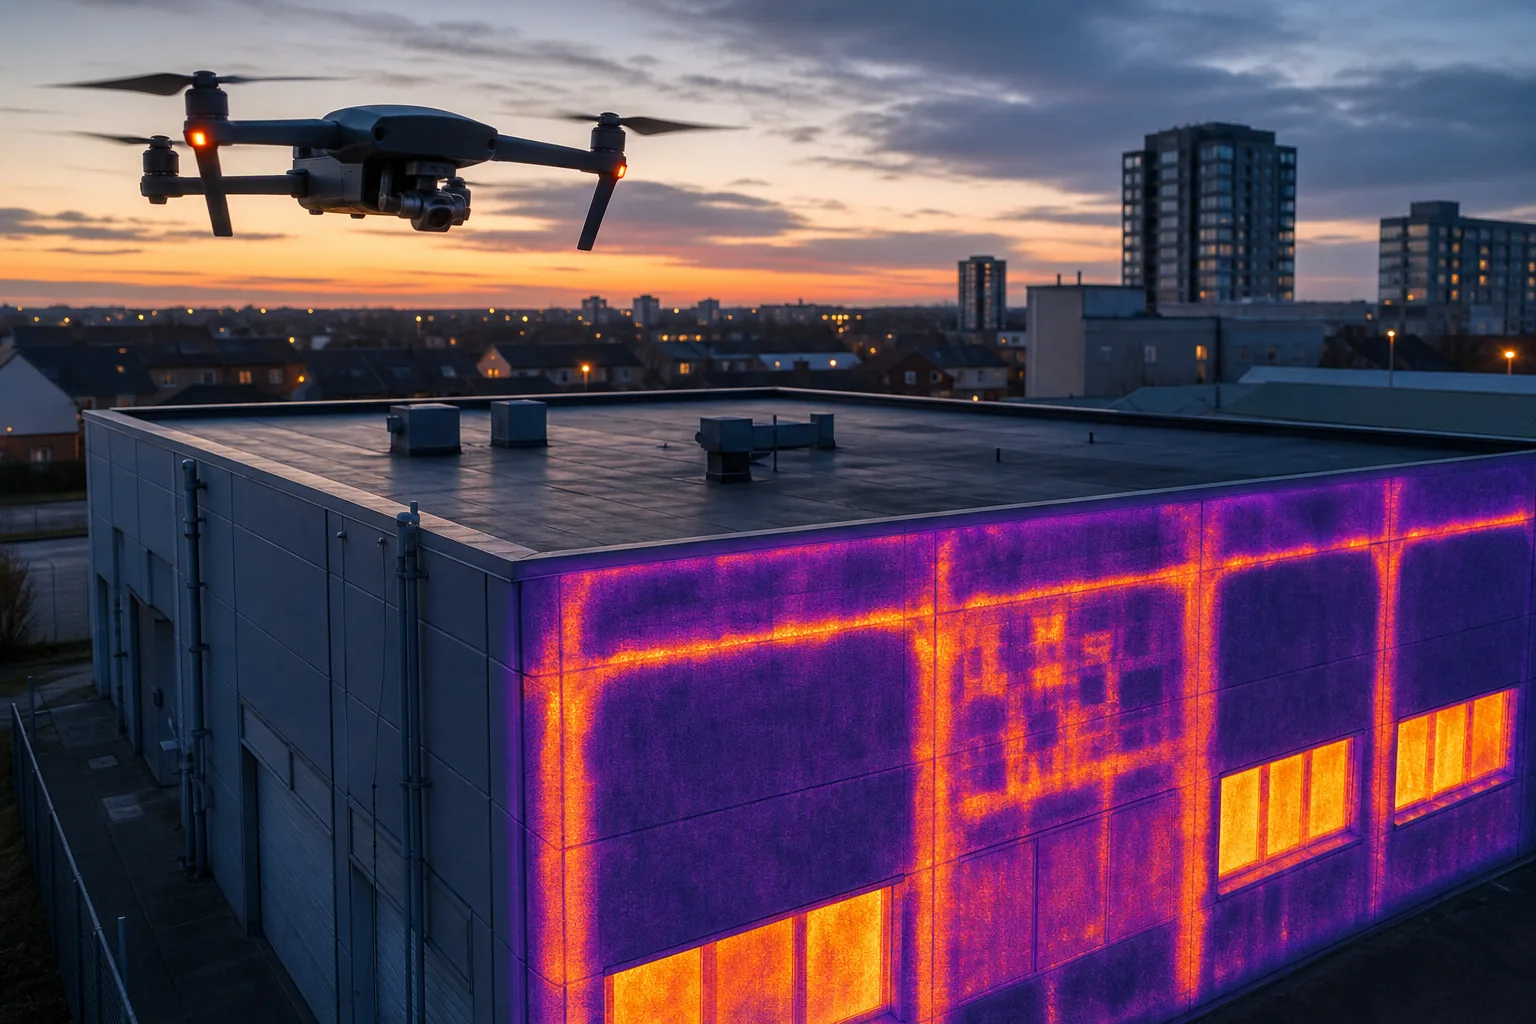
Building envelope testing pinpoints where heat, air and moisture slip through the fabric of a structure. Get the steps you need to plan, capture and act on the data, and keep your assets performing.
Step 1: Define the Building Envelope Testing Objective
First, write a clear brief that names the problem you want to solve , heat loss, air leakage, moisture ingress, or a mix of all three. A short scope helps the survey team focus on the right parts of the building and avoids costly re‑runs.
Ask yourself: which zones are most critical? Flat roofs, curtain‑wall façades, cavity walls, or service penetrations often hide the biggest deficits. Flag any known issues , past roof repairs, failed insulation, or recent retrofits , so the team can target those areas.
When you have a brief, match it to the standards your client needs. For public‑sector estates, PAS 2035 and BREEAM expect documented heat‑loss values and airtightness results. Aligning your objective with those requirements means the final report can be used straight into funding applications.
By defining the objective early, you turn a vague inspection into a data‑driven decision tool. Research on envelope testing shows it reduces energy waste and improves indoor comfort. You’ll be in good hands.
Step 2: Review Existing Information and Assess Access Risks
Gather any past surveys, plans, and maintenance logs. Old thermal images, blower‑door results, or structural drawings can reveal patterns that a fresh scan will miss.
Check the building’s height, roof pitch and any surrounding obstacles. Trees, nearby structures or limited landing zones can restrict drone flight paths. If the site is a heritage building, special permissions may be required before you send a UAV up.
Map out the safest entry points for staff. Ladder work on fragile roofs or confined façades adds risk. Where possible, let the drone do the heavy lifting , it keeps people on the ground and speeds up data capture.
During this review, note any health‑and‑safety constraints , asbestos, fragile plaster, or active fire‑sprinkler zones. Flag them for the pilot so the flight plan respects exclusion zones.
We at Visual Perspectives Limited run a pre‑flight risk assessment as part of every contract. It saves time and avoids surprises on site.
Step 3: Select the Right Building Envelope Testing Methods
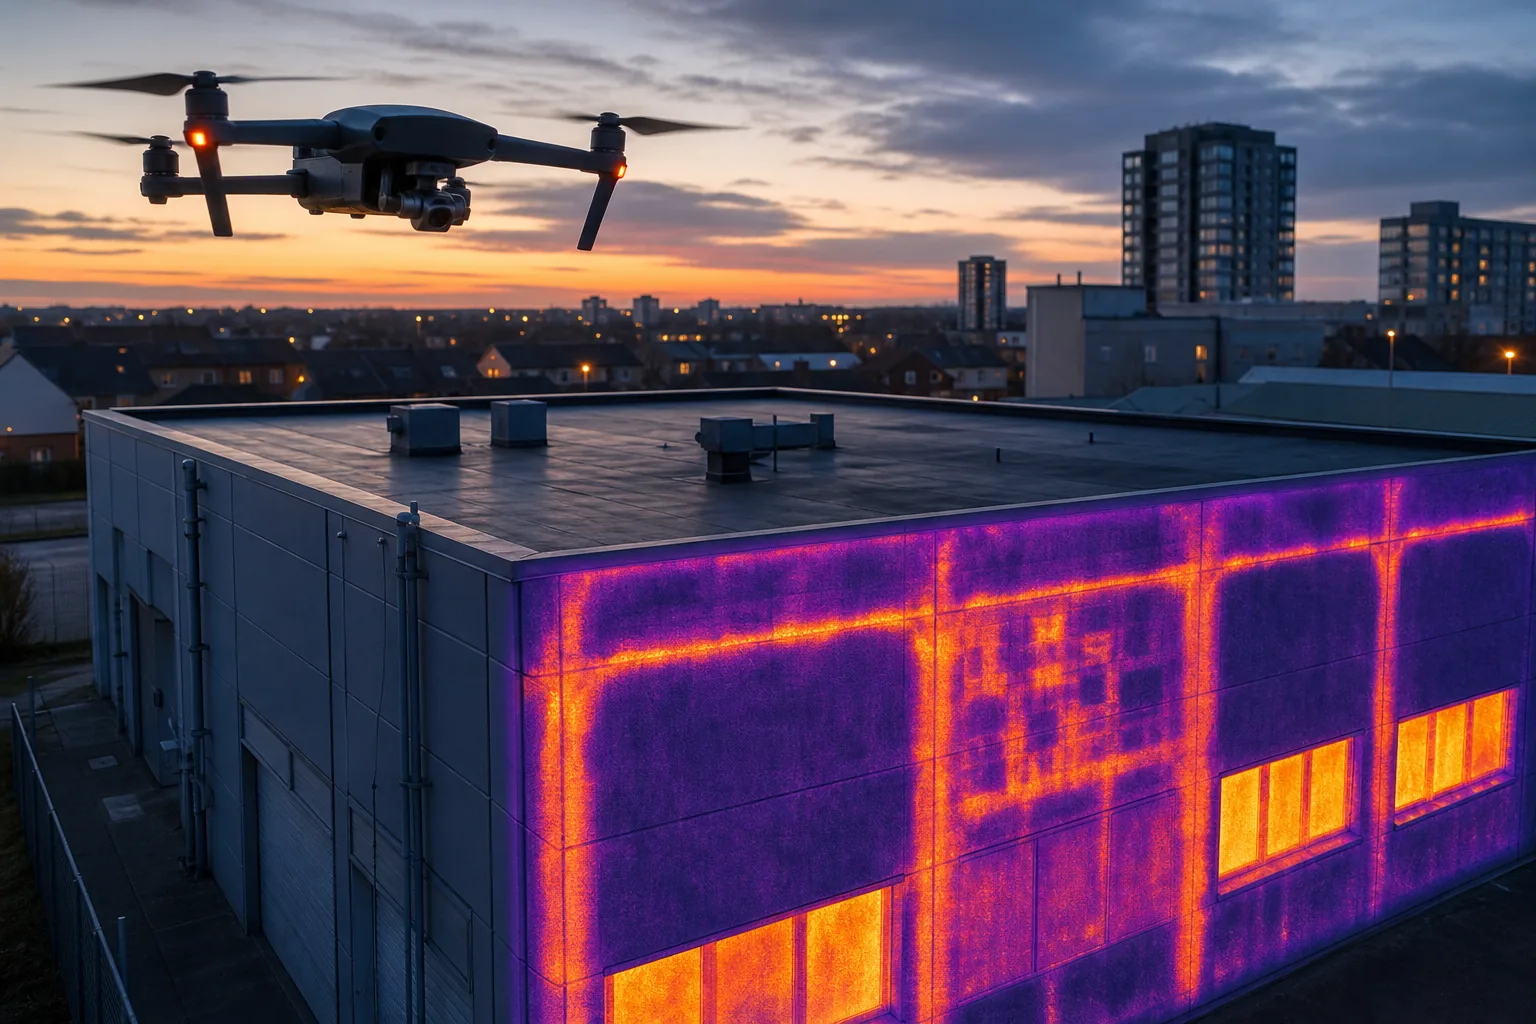
Choose tools that match the objective you set in Step 1. For heat‑loss detection, combine an infrared thermal imaging heat loss survey with pressure testing. The pressure‑induced airflow highlights where warm indoor air escapes, and the thermal camera visualises the resulting temperature gradients.
Moisture detection needs a two‑stage approach. First, scan the surface with a radiometric thermal camera. Then, confirm any cold or warm anomalies with a suitable moisture‑measurement instrument. This prevents false positives that pure visual checks can miss.
Drones bring speed and safety to the process. A three-dimensional survey model lets you measure crack widths, roof slopes and façade geometry without ever touching the surface.
Make sure the equipment meets recognised standards. For compliance reporting, IEC 62446‑3 provides the framework for solar‑PV related thermal data, which we also follow for non‑PV envelopes.
When you pair aerial thermal imaging with ground-based moisture measurements, you get a full picture of heat loss, air leakage and hidden damp.
Our own service bundles the 3‑D model, thermal overlays and a defect‑diagnostics report , a combination only a handful of UK providers can claim.
Step 4: Carry Out the Inspection Under Suitable Conditions
Timing is important. Aim for a clear, calm morning when interior heating has raised the indoor temperature at least 10 °C above the outside. That temperature differential creates the contrast needed for reliable thermography.
Avoid direct sunlight on the façade , solar loading can mask the thermal signature of damp or missing insulation. If you must work after sunrise, wait at least an hour for the building skin to cool down.
Follow the flight plan you drafted in Step 2. Keep the drone at 15, 30 m altitude for flat roofs, lower for steep pitches, and maintain at least 70 % image overlap for a smooth orthomosaic.
While the drone captures data, a technician should conduct a visual walk‑around, noting any obvious cracks, broken flashings or signs of water ingress. Those observations guide where to hover for extra thermal passes.
After the flight, download the raw files and run a quick quality check. Blurry frames or gaps in coverage mean a re‑flight is needed before you leave the site.
We follow BS EN 13187 best practice for thermal surveys, which recommends early‑morning or late‑evening slots in the heating season. You’ll finish the day with a complete data set ready for analysis.
Step 5: Interpret Findings and Produce an Actionable Report
Start by stitching the overlapping images into a single orthomosaic. Align the thermal layer to the RGB base map so each temperature pixel sits over the correct building feature.
Mark every anomaly , cold spots that may indicate moisture, hot spots that point to heat loss, and linear patterns that suggest thermal bridges. Record the temperature delta for each; a difference over 5 °C usually signals a significant issue.
Cross‑reference each thermal finding with the visual notes you took on site. If a cold patch sits next to a cracked flashing, the combined evidence points to a roof leak.
For moisture anomalies, add moisture readings. The report should list location, measured temperature delta, moisture content and a recommended remedial action.
Structure the report to match IEC 62446‑3 requirements: executive summary, defect map, detailed table of findings, and a next‑steps checklist. The table lets facilities managers see at a glance which issues have the highest energy‑cost impact.
We deliver the final package as a 3‑D model with thermal overlays, a PDF defect log and a GIS‑ready dataset you can feed into your asset‑management system.
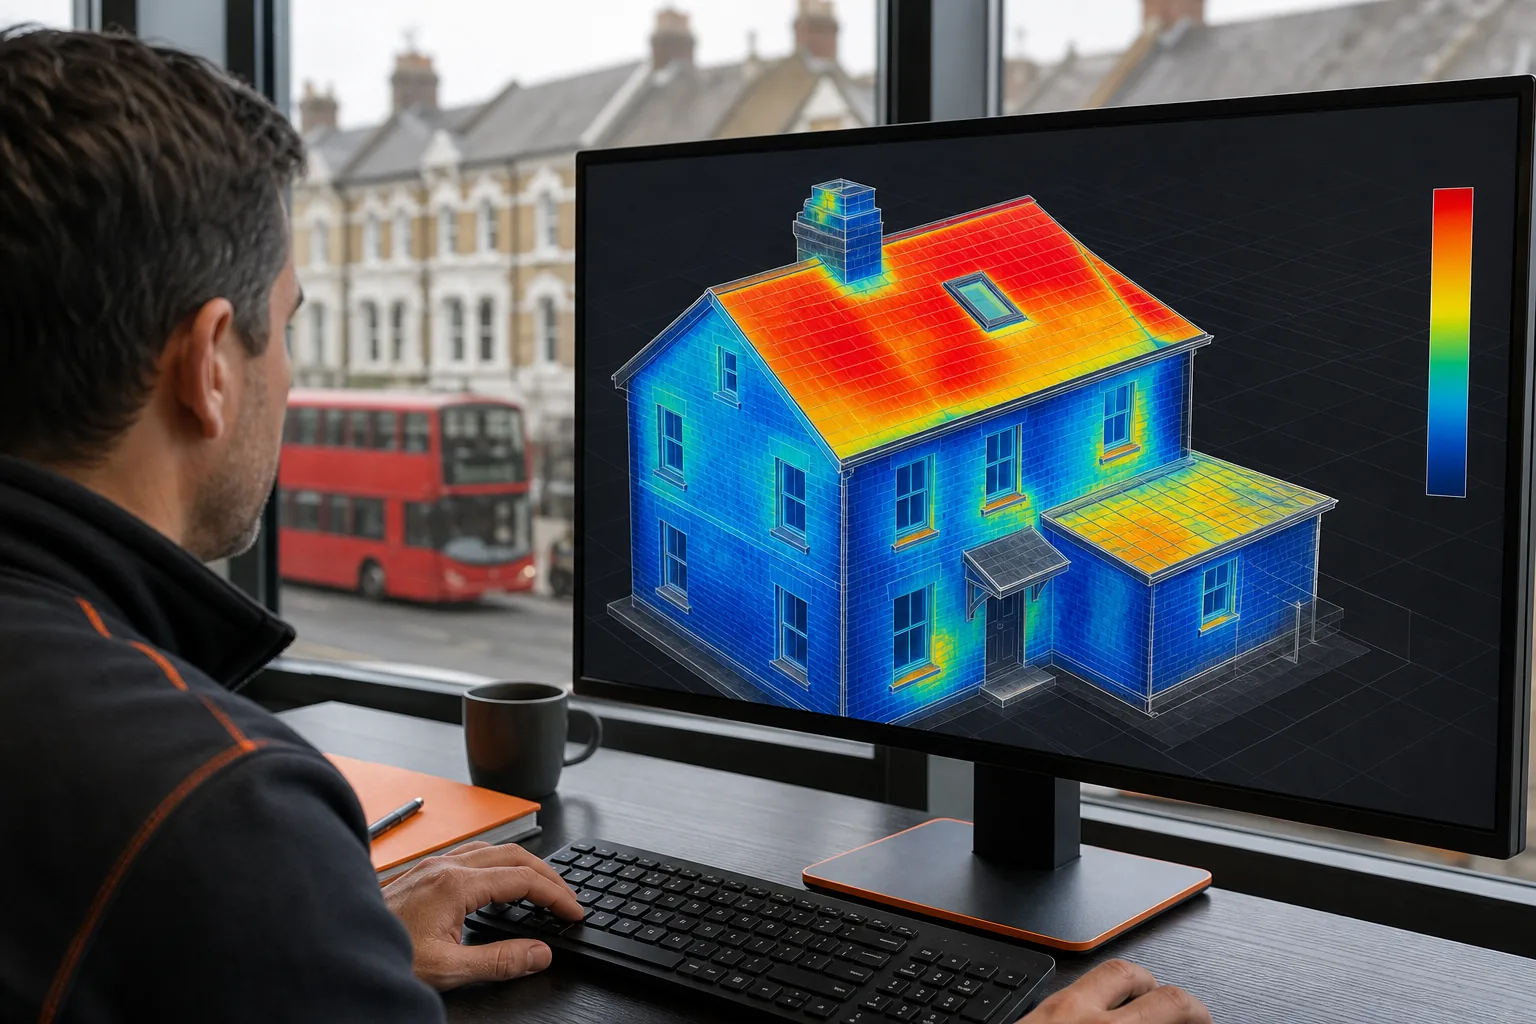
When you hand the report to the client, walk through the top three findings and explain the cost‑benefit of fixing each. That conversation turns raw data into a prioritized retrofit plan.
Our experience shows that clients who act on the first‑ranked defect cut heating bills by up to 15 % within a year.
FAQ
What is building envelope testing?
Building envelope testing is a set of inspections that measure heat loss, air leakage and moisture movement through a building’s skin. It uses tools like thermal cameras, air‑leakage equipment and drones to capture data that the naked eye can’t see.
Why combine drones with thermal imaging?
Drones let you reach high or hard‑to‑access areas safely while capturing high‑resolution imagery. Thermal imaging adds the ability to see temperature differences that point to insulation gaps or hidden damp.
Do I need a specialist to interpret thermal images?
Yes, a trained thermographer understands how material emissivity, weather conditions and camera settings affect the image. They can separate real defects from false positives.
How often should I schedule building envelope testing?
Most public‑sector estates run a full envelope test every 5 years, or after major works like roof replacement or façade refurbishment. More frequent checks may be needed if you notice rising energy bills.
Can building envelope testing help with PSDS Phase 4 funding?
Absolutely. The data provides the evidence required for energy‑efficiency calculations and risk assessments, both of which are key parts of a PSDS Phase 4 application.
What standards should the report follow?
The report should meet IEC 62446‑3 for thermal data, PAS 2035 for retrofit guidance and any relevant BREEAM criteria. Aligning with those standards ensures the findings are accepted by funders and regulators.
Ready to start?
Contact Visual Perspectives Limited to schedule a pre‑survey briefing and get a quote tailored to your estate.