Heat loss should be measured, not guessed. A sound survey links indoor conditions, weather, energy use and building fabric so your retrofit plan rests on evidence.
This building heat loss measurement guide sets out a usable process for schools, NHS estates, housing associations and other public-sector buildings. We’ll show where thermal imaging helps, where it does not, and when to use a whole-building test.
Step 1: Define the Building and Heat Loss Question
Start by stating what you need the heat loss survey to answer. A clear question controls the method, the site plan and the final report.
Decide whether you need to measure the whole building or locate faults in part of the envelope. These are different tasks. A roof scan may find missing insulation, wet areas or cold joints. It will not, by itself, produce a whole-building heat-loss coefficient.
Write down the building’s use before planning the survey. A school has changing occupancy through the day. An NHS building may have strict temperature and access rules. A housing block may need results that can be compared across many properties.
Gather the core records:
- Floor plans and elevations.
- Construction dates and known refurbishment work.
- Roof, wall and window build-ups, where available.
- Heating and ventilation system details.
- Energy bills or meter data.
- Previous condition, damp or airtightness reports.
Set the project boundary. Include the roof, walls, windows, doors, floor edges and service penetrations when the question concerns the building envelope. Include ventilation and infiltration when air leakage may explain high demand.
A whole-building metric is often the heat-transfer coefficient, also called the heat-loss coefficient. It describes heat flow against the difference between indoor and outdoor temperature. The term is useful because it gives a common measure for comparing buildings or checking a retrofit.
A peer-reviewed study of co-heating tests found that seven teams measuring the same UK house reported heat-transfer results within ±10% of the mean. The study also considered the uncertainty associated with the test results. Read the peer-reviewed research on co-heating test reliability for the test limits and methods.
For a public-sector estate, link the question to the investment decision. You may need evidence for a fabric-first retrofit, a PSDS Phase 4 business case or a post-works quality check.
Visual Perspectives Limited can help set the survey boundary before fieldwork. We combine building thermography with roof and façade inspection, so the brief addresses what the naked eye can’t see without losing sight of the wider asset condition.
Step 2: Prepare the Site and Select Measurement Conditions
A reliable building heat loss measurement guide must deal with site conditions before anyone collects data. Poor timing can make a good camera produce a weak result.
Choose a survey window with a useful temperature difference between inside and outside. The building needs a stable heat pattern. Avoid scanning straight after a major change in heating, an open-window period or a sudden weather shift.
Record the forecast before booking the work. Rain can alter surface temperatures. Wind can cool exposed walls and disturb the pattern around openings. Direct sun can warm one elevation long after the air temperature has fallen.
Plan the work around occupation. Tell site staff which rooms need access. Note rooms with unusual heat sources, plant rooms, kitchens, server equipment or medical systems. These areas may show a genuine thermal pattern that has nothing to do with missing insulation.
Complete a safety and access review:
- Confirm roof access and edge protection requirements.
- Check whether a drone flight needs site approval.
- Record nearby roads, people, trees and overhead cables.
- Agree where indoor readings can be taken.
- Set rules for secure areas and patient-facing spaces.
Use a consistent survey route. Mark each elevation and room so the report can match an image to a location. A thermal image without orientation is hard to act on. A facilities manager needs to know whether the defect sits above a ward, beside a classroom or at a roof plant zone.
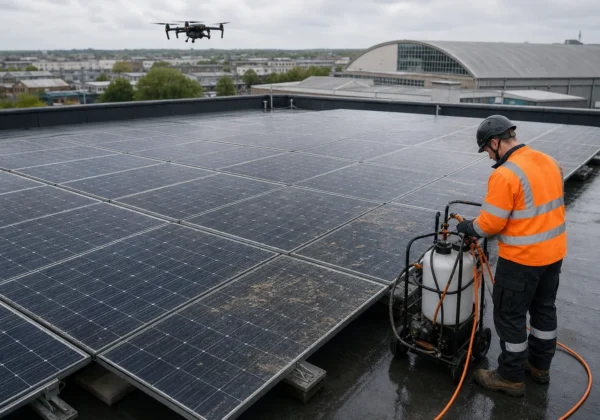
Set the instrument plan before arrival. A thermohygrometer can capture point readings for air temperature and humidity. A radiometric thermal camera records surface temperature patterns. A drone-mounted camera can cover roof areas that would otherwise need scaffolding or difficult access, subject to flight controls and site conditions.
Do not treat a drone flight as a complete diagnosis. Aerial data can show patterns across the envelope. It may need indoor checks, moisture readings or intrusive inspection before a repair is specified.
Visual Perspectives Limited plans drone roof surveys around access, weather and line-of-sight requirements. We work across education, healthcare, housing and commercial estates, with a focus on evidence that a surveyor or project team can use.
Step 3: Capture Temperatures, Weather and Building Energy Data
Collect the readings as one evidence set. A thermal image is strongest when you can relate it to room temperature, outdoor weather and building operation.
Begin with a site log. Record the date, time, surveyor, instrument details and weather. Note wind, cloud, rain, sun exposure and recent heating changes. Record the building’s occupied state because heat from people and equipment can affect internal surfaces.
Take outdoor air readings near the building, but avoid locations affected by exhausts or plant discharge. Take indoor readings in representative rooms. Include rooms with reported comfort issues and rooms that appear typical.
For each location, record:
- Indoor air temperature.
- Relative humidity.
- Outdoor air temperature.
- Surface temperature where relevant.
- Heating or ventilation status.
- Room use and occupancy at the time.
Use energy data with care. Monthly bills can show a pattern, but they do not explain which element causes the loss. Half-hourly meter data may show heating response and overnight baseload. Keep the billing period and weather period clear in the report.
When a whole-building test is planned, control the test conditions. Keep heating at a known level. Limit unnecessary window opening. Record internal gains from equipment and occupants. The test model needs these inputs because heat loss through fabric is only one part of the building’s energy balance.
Dynamic tests can be shorter than quasi-steady tests, but they need a suitable model. Methods such as QUB infer building heat transfer from temperature and energy measurements during a heating or cooling period. A co-heating test takes longer because it holds the building at a raised, stable temperature.
Keep an uncertainty log. Note sensors that were moved, rooms that could not be entered and areas hidden by stored goods. State what the data can prove and what it cannot prove.
For a more detailed fabric workflow, our building fabric heat loss assessment guide explains how survey findings can support retrofit planning.
Use one naming system for all files. A room code, elevation code and image number will prevent confusion when the report moves between the surveyor, estates team and retrofit designer.
Step 4: Choose and Apply an Appropriate Heat Loss Method
The right method depends on the question, building size, access and required confidence. Thermal imaging locates patterns. Whole-building tests measure overall performance.
Use the following decision view before you commit to fieldwork:
| Method | Best use | Main evidence | Key limit |
|---|---|---|---|
| Thermal imaging | Locate cold bridges, insulation gaps and abnormal surface patterns | Radiometric images with site notes | Needs suitable temperature difference and weather |
| Drone-mounted thermal imaging | Review roofs and high façades without routine scaffold access | Aerial thermal data linked to visible imagery | Needs safe, authorised flight conditions |
| Co-heating test | Measure whole-building fabric heat transfer | Controlled heating and energy balance | Needs a long, stable test period |
| Dynamic method | Estimate heat transfer over a shorter test period | Temperature and energy response model | Results depend on model inputs and building behaviour |
| Air leakage testing | Assess uncontrolled air movement through the envelope | Pressure test results and leakage diagnosis | Does not measure every fabric heat-flow path |
Do not compare a thermal image with a heat-loss coefficient as if they are the same output. A thermal image is a map of surface temperature. A heat-loss coefficient is a whole-building performance measure. They answer different questions.
Use a combined approach when the project needs both scale and cause. A whole-building result may show that performance is poor. Thermal imaging can then help locate the likely weak zones. Follow with targeted inspection where the cost or risk of repair is high.
Academic work on in-situ methods includes QUB, dynamic integrated testing, ISABELE and short perturbation methods. It also notes the need to account for solar gains in steady-state whole-building measurements. That matters because sun-warmed surfaces can distort a simple heat-balance calculation. The research review of in-situ whole-building heat-loss methods sets out these method families.
For public-sector procurement, ask the provider to state:
- What the method measures.
- Which assumptions affect the result.
- How weather and solar gains are handled.
- What accuracy or uncertainty information is available.
- Which rooms or surfaces were excluded.
- How findings link to repair or retrofit action.
Visual Perspectives Limited combines aerial thermal imaging with high-resolution 3D mapping. That gives the project team a measured view of the envelope and a spatial record for planning follow-up work. Our surveys are quickly, precise, and detailed, but the method still depends on weather, access and correct interpretation.
Step 5: Use Thermal Imaging to Locate Heat Loss and Defects
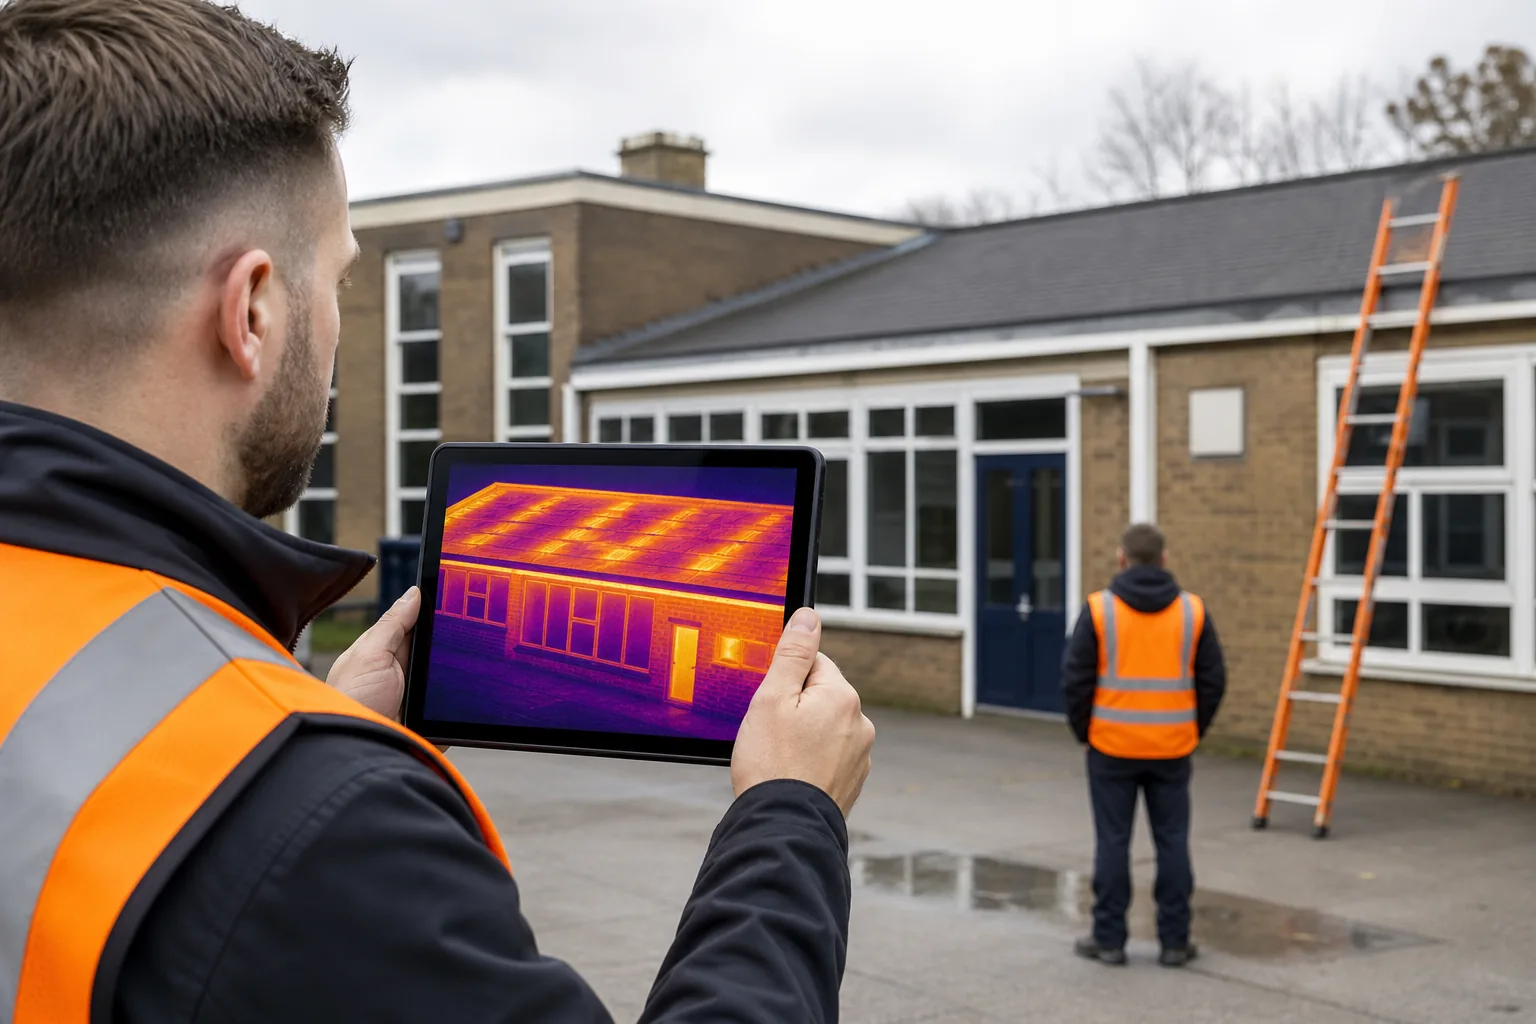
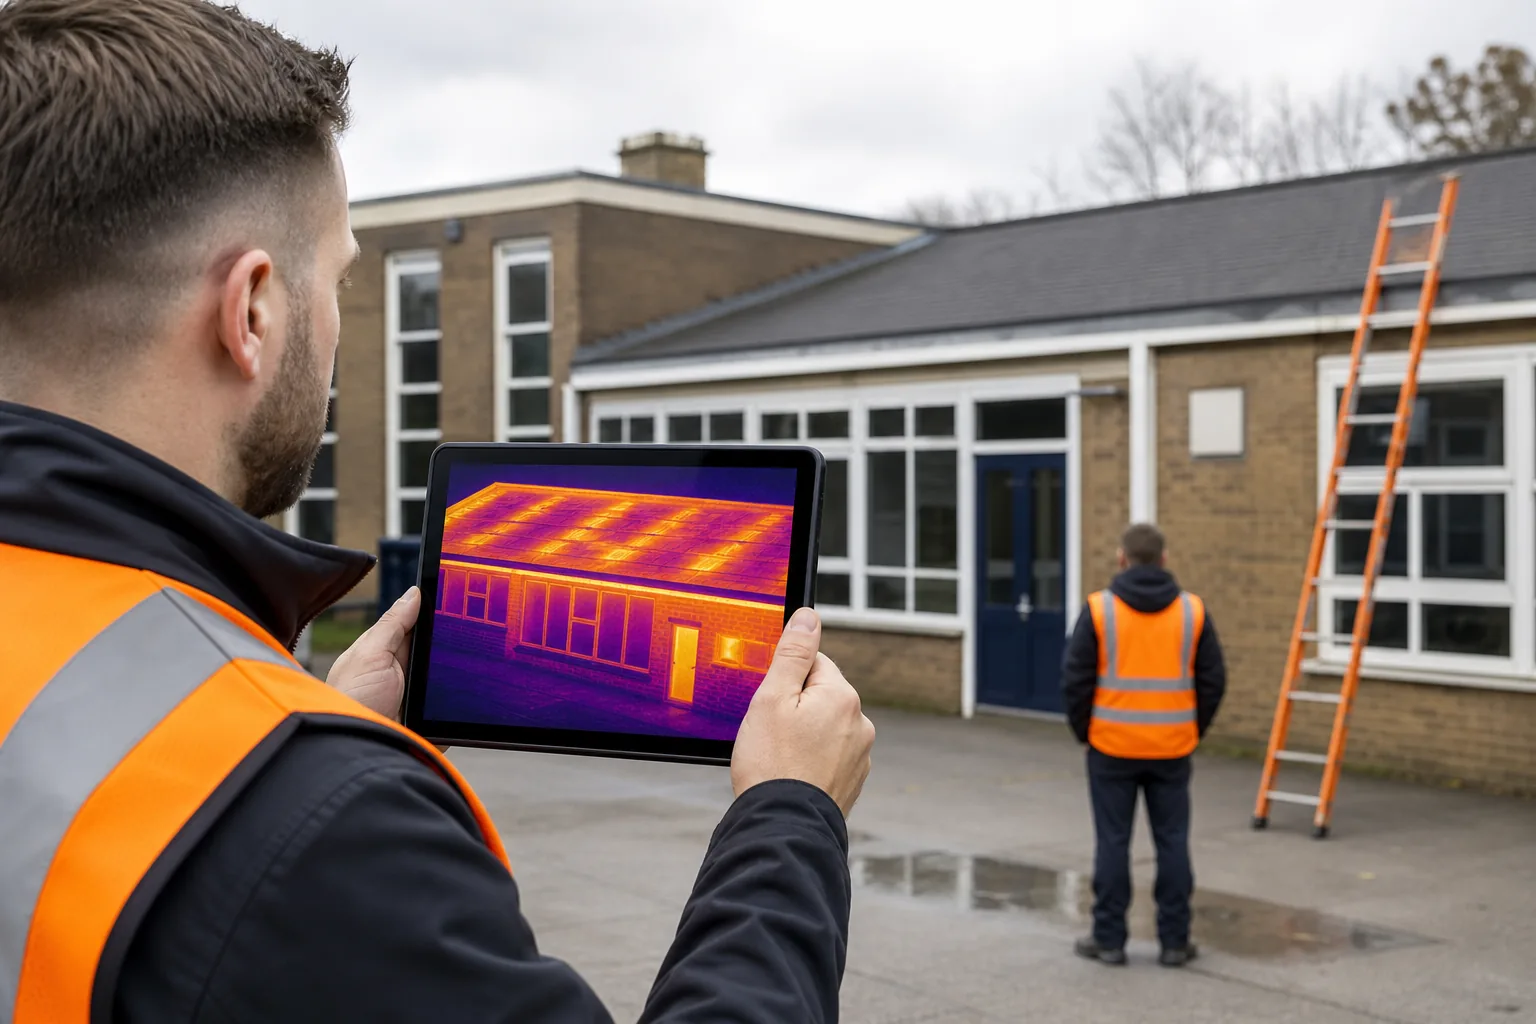
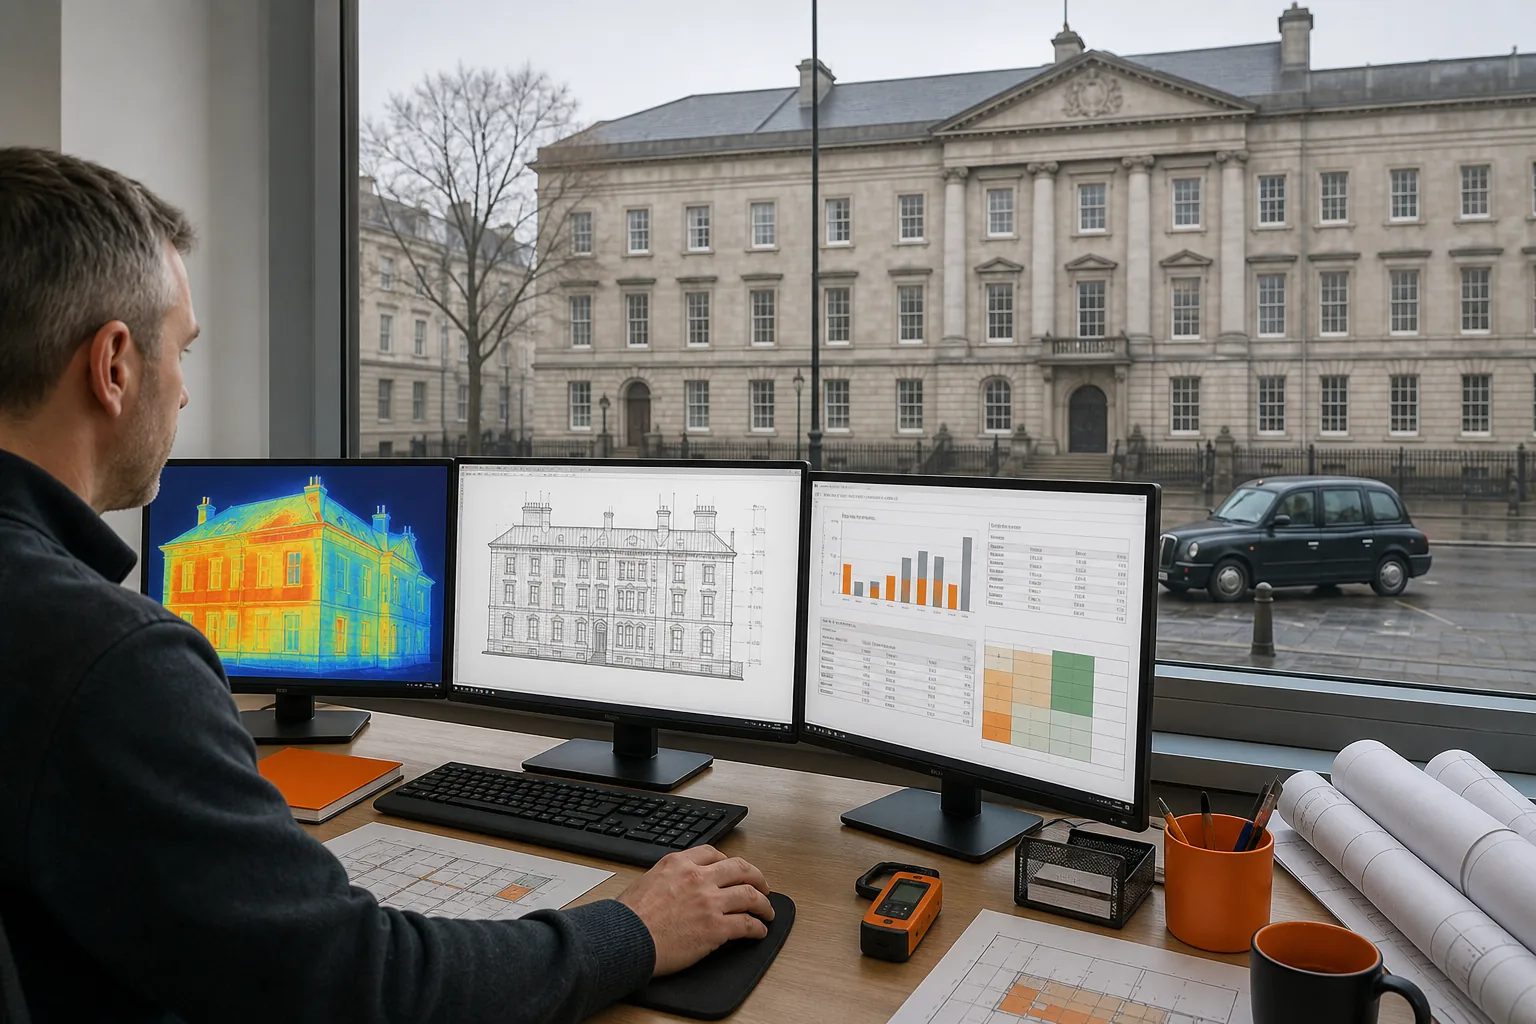
Thermal imaging is most useful when you read patterns, not isolated colours. The aim is to locate a likely defect and decide what evidence should follow.
Scan the building in a repeatable order. Work around the outside first, then inspect selected internal surfaces. Keep the camera angle as close to square as access allows. Oblique views can change the apparent temperature and make comparison harder.
Review the main defect types:
- Cold bridges at slab edges, corners and junctions.
- Missing or thin insulation.
- Air leakage around windows and doors.
- Wet roof insulation or trapped moisture patterns.
- Heat loss around service penetrations.
- Uneven heating caused by pipework or plant.
Check emissivity and reflections before drawing a conclusion. Metal cladding and wet surfaces can reflect nearby heat sources. Glass can reflect the surveyor or sky. A bright patch may be a reflection rather than a hot component.
Pair each thermal image with a visible image and location note. Add the scale, temperature range, focus point and surrounding conditions. Mark the finding on a plan or 3D model where the project team needs to return.
Use thermal imaging to guide further checks. A cold strip beside a window may point to a thermal bridge, failed seal or damp reveal. The image identifies the pattern. Moisture measurement, air testing or opening-up work may be needed to identify the cause.
Research on infrared inspection shows why image interpretation needs context. Camera output reflects surface conditions and measurement limits, so the report should explain how the images were captured and read. A peer-reviewed review of infrared thermography research provides further background on thermal imaging use and interpretation.
Our building envelope thermal imaging best practices resource covers image capture, weather checks and defect reporting in more detail.
For a school estate, group results by building and defect type. For an NHS estate, add access restrictions and service continuity risks. For housing, record whether the same pattern appears across a block or only in one dwelling.
End with an action grade that your asset team understands. Separate urgent safety or water-ingress issues from fabric improvements that belong in a planned retrofit package. Good reporting turns a coloured image into a work order.
FAQ: Building Heat Loss Measurement
How do you measure heat loss in a building?
You measure building heat loss by combining temperature, weather and energy data with an inspection of the envelope. Thermal imaging locates unusual surface patterns, while co-heating or dynamic tests can estimate whole-building heat transfer. The correct method depends on whether you need a defect location, a whole-building metric or evidence for a retrofit decision.
Can thermal imaging measure total building heat loss?
Thermal imaging cannot measure total building heat loss on its own. It records surface temperature patterns and helps locate cold bridges, insulation gaps, moisture-related anomalies and air leakage paths. To measure overall performance, pair it with a whole-building method or a suitable energy and temperature model.
What weather is best for a heat loss survey?
Cold, stable conditions with a clear indoor-outdoor temperature difference are usually most useful. Avoid rain, strong wind and direct sun on the survey face where possible. Record the weather throughout the work because wind, wet surfaces and solar gain can change thermal patterns and affect interpretation.
Is a drone heat loss survey suitable for a school or NHS estate?
A drone heat loss survey can suit large or hard-to-access roofs and façades, subject to safe flight approval. It gives estate teams a broad view without treating scaffold as the default access route. Indoor checks may still be needed, especially around windows, occupied rooms, plant areas and suspected air leakage.
What should a heat loss survey report include?
A useful report includes the method, site conditions, equipment details, building areas inspected and limits on the findings. It should link each image to a location and describe the likely defect in plain terms. Add repair priorities, recommended follow-up tests and enough evidence for a surveyor or project manager to act.
Conclusion
Start with the decision your estate needs to make, then select the least complex method that can answer it with confidence. Visual Perspectives Limited provides independent thermal imaging, drone roof surveys and building envelope diagnostics across the UK. Share your building records and survey aim with our team so the next inspection produces evidence you can use for retrofit and decarbonisation.