Need an exact digital replica of a building before you design, retrofit or sell? A 3D building survey records the building’s visible geometry in detail and can pair it with thermal data to support informed decisions.
We’ll explain what a survey delivers, how the data is captured, how to interpret the model, where it can help estate teams, and what to consider when commissioning one.
What is a 3D building survey?
A 3D building survey records a structure’s visible shape using laser scanning or photogrammetry. The measurements are processed into a registered point cloud: a dense collection of XYZ coordinates representing captured surfaces.
The point cloud can be measured directly or used to produce floor plans, elevations, sections and BIM models. Unlike hand-drawn drawings based on visual estimation, it is derived from a large number of recorded measurements.
Visual Perspectives Limited’s 3D Mapping Service combines high-resolution drone capture with thermal imaging, where specified, to provide geometric and heat-loss information together.
Depending on the project brief, clients may request the raw point cloud for later modelling or finished CAD/BIM deliverables at an agreed level of detail.
A survey records visible surfaces only. Opaque walls and concealed services will not be revealed, so a separate investigation is needed if those are important to the project.
For more on the differences between a raw point cloud and a finished drawing, see our guide on Measured Building Survey Explained.
Wikipedia’s definition of point clouds describes them as “a set of data points in space produced by 3‑D scanners or by photogrammetry software.” Survey accuracy depends on the capture method, control and processing, so check the project-specific accuracy statement rather than relying on a general figure.
How 3D survey data is captured
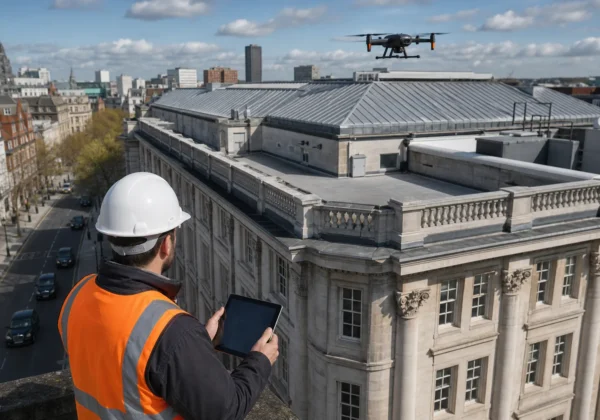
Work begins with a site walk-through to identify obstacles, safety hazards and access routes. That review informs the capture method: drone photogrammetry for roofs and façades, handheld LiDAR for tight interiors, or a static terrestrial laser scanner for large, complex spaces.
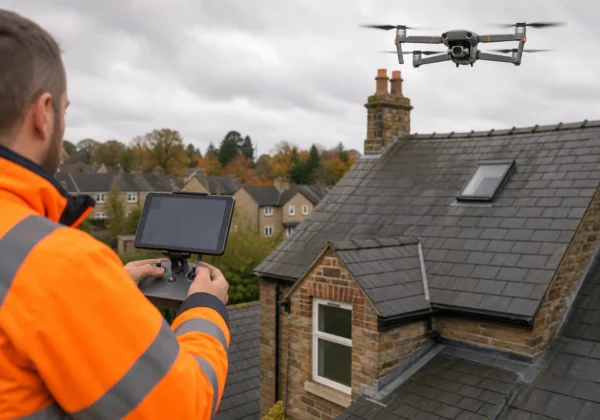
Drone flights can follow a grid pattern with appropriate image overlap, adjusted to site conditions and the required output. The UAV records high-resolution RGB imagery and, where required, calibrated thermal imagery, with location data attached.
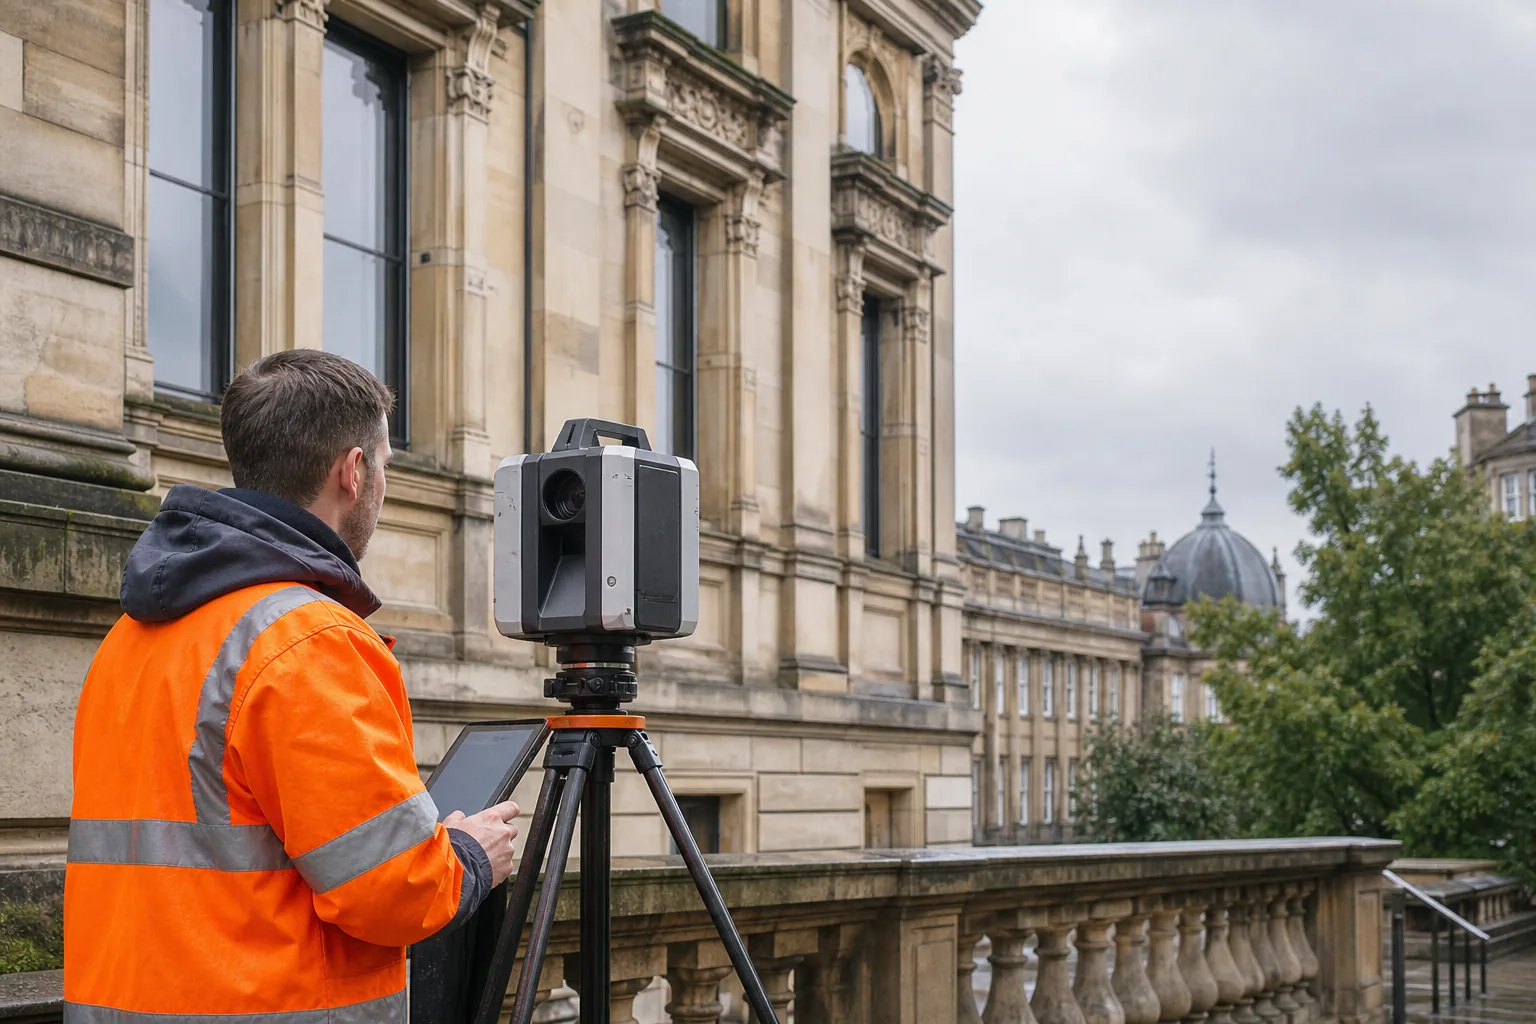
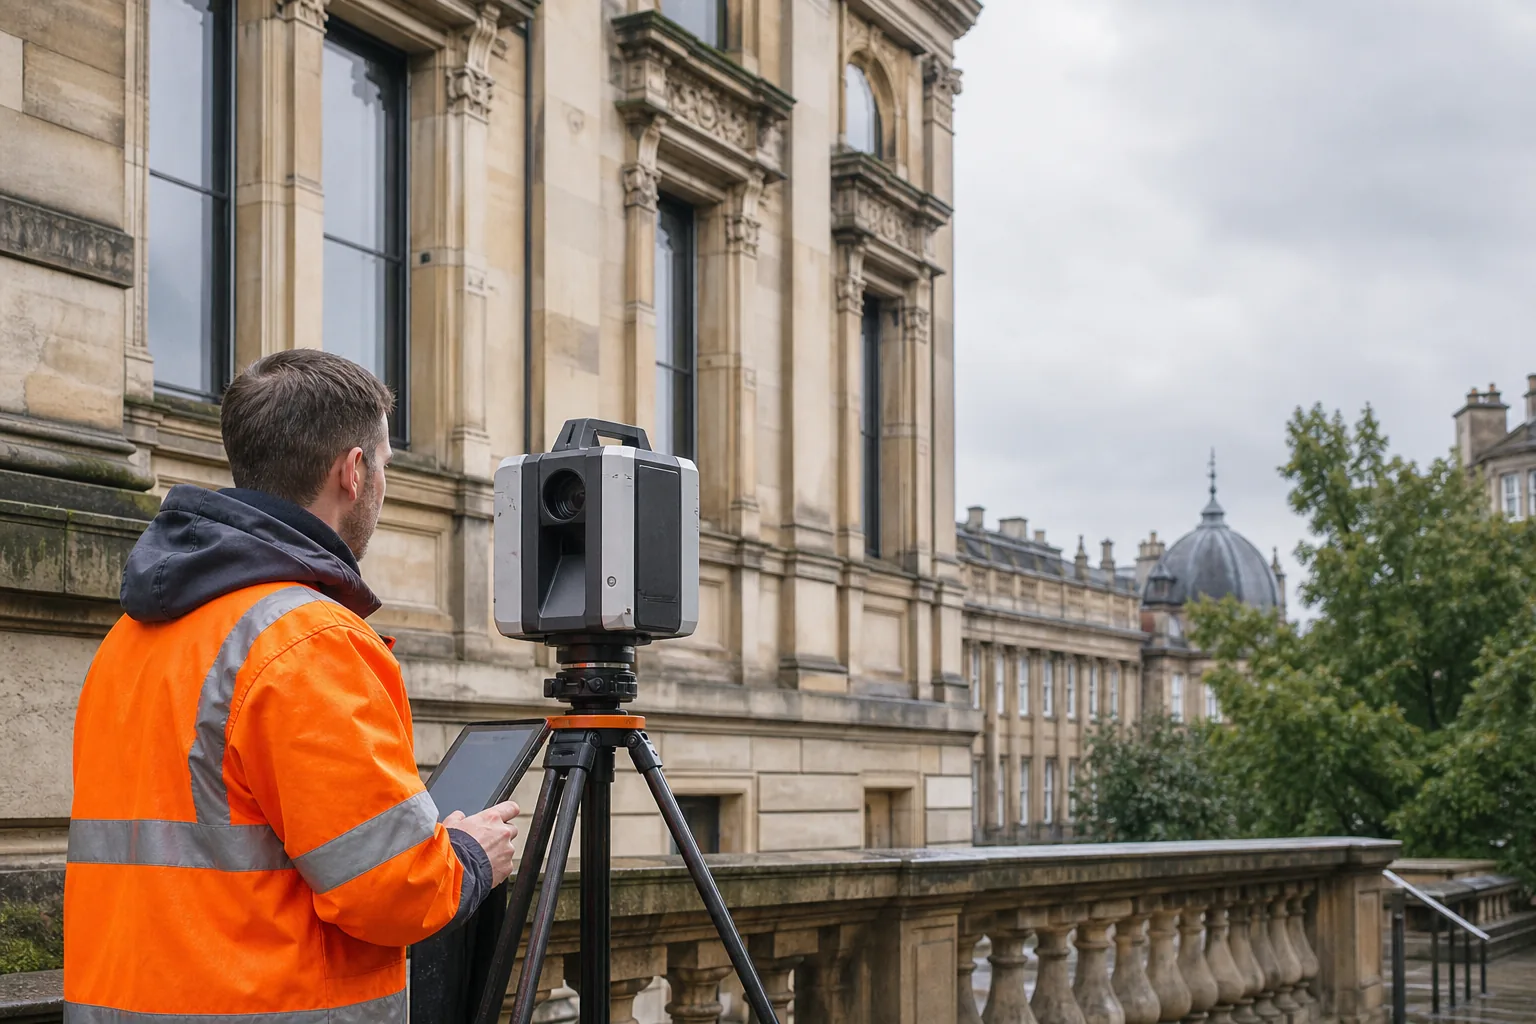
On the ground, a terrestrial laser scanner (TLS) emits laser pulses, records their return time and calculates distances to build a dense set of measured points. The surveyor scans from multiple stations, uses targets or other control for registration, then combines the scans into a single cloud.
Aerial and terrestrial data are processed to align point clouds, remove stray points and create a unified model. The achievable accuracy depends on equipment, control, site conditions and the required deliverable; the survey specification should state the tolerances that apply to the project.
Combining drone photogrammetry with TLS can help cover mixed-use estates: aerial capture reaches roof edges and façades, while interior scanning records spaces that cannot be captured from outside.
When thermal imaging is required, the camera and capture process should be checked and calibrated in accordance with the survey method. Thermal imagery can then be related to the geometric model, subject to suitable conditions and accurate data alignment.
Pro Tip: Ask the survey team for a sample of the raw point cloud early in the process. Comparing a few known dimensions with the cloud can help identify registration issues before the full model is prepared.
What the model shows and how to interpret its accuracy
The finished model may be delivered as a raw point cloud (E57, LAS or RCP), a mesh (GLB/OBJ) for visualisation, or a BIM-ready Revit/IFC file containing elements such as walls, floors and openings.
Accuracy is normally stated as a tolerance, such as 1 to 3 mm for room-scale scans or ±5 mm for some whole-building surveys. These are examples, not guarantees: confirm the specified tolerance, control method and limitations for the particular building and deliverable.
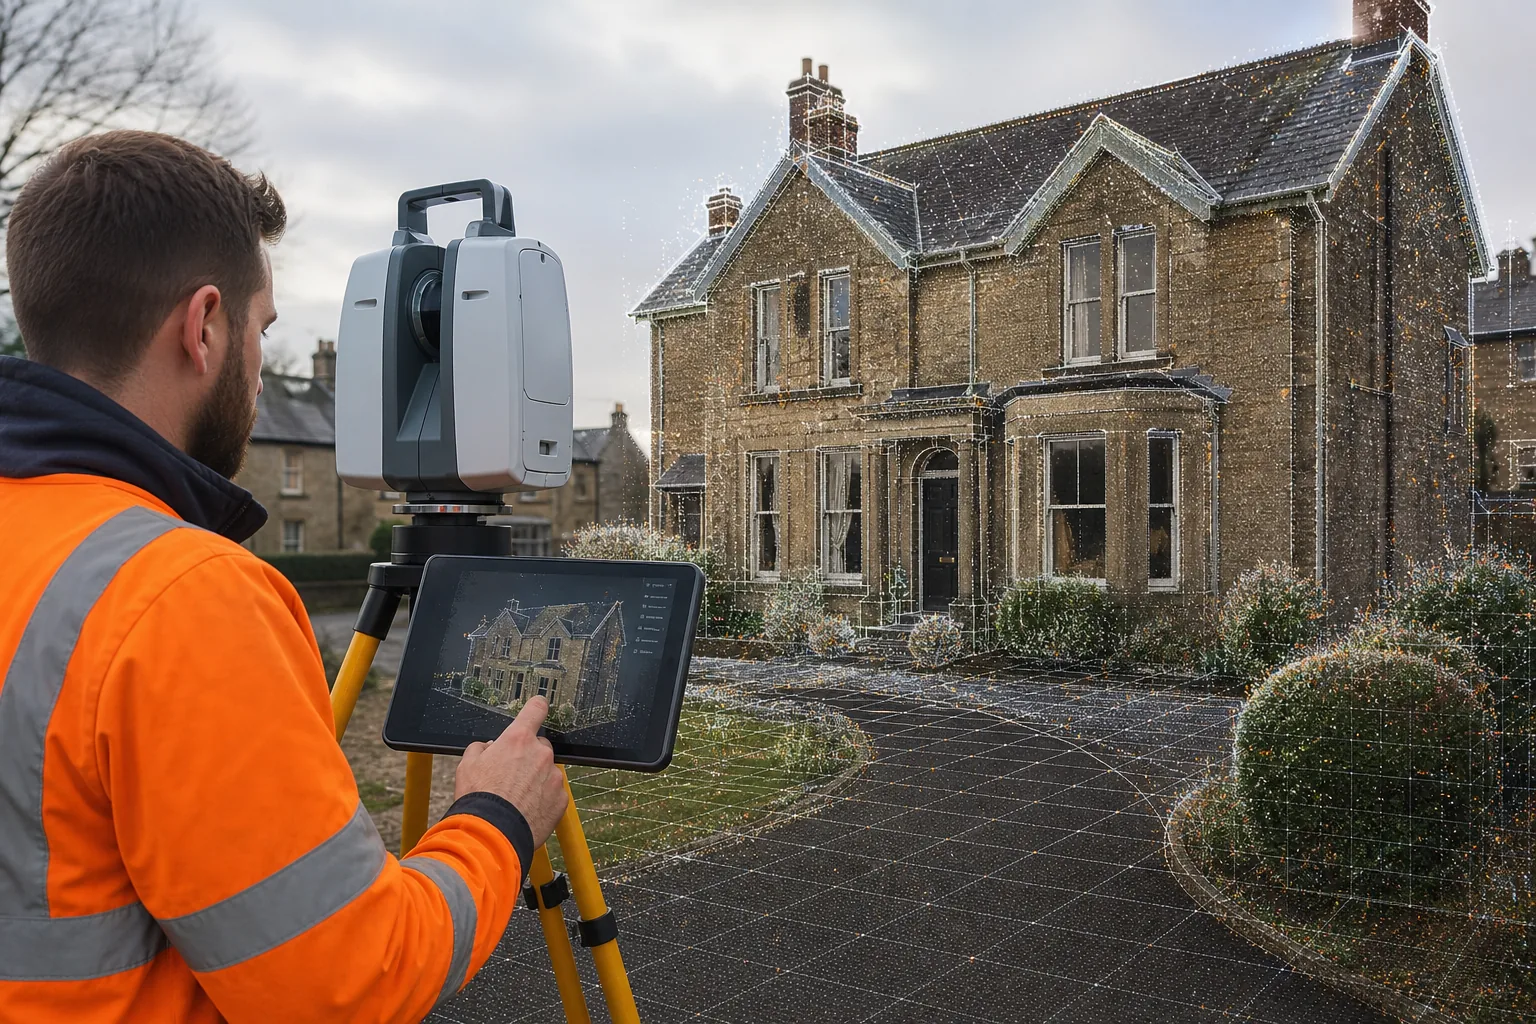
The model can show wall positions, opening sizes, roof pitches and visible service penetrations. If suitable thermal data is added, colour-coded areas may indicate temperature patterns associated with heat loss, cold bridging or possible moisture; these observations require interpretation in context.
Geometry can be reviewed by slicing the model in a BIM viewer. You can isolate floor-by-floor sections, check ceiling heights or run clash detection against proposed MEP services.
The model represents the building as captured on the survey date. Later alterations will not appear unless a further survey is commissioned.
The survey documentation should include an accuracy statement describing the control points, measured tolerances and any deviations identified during registration.
Where 3D building surveys help estate and project teams
Public-sector estates, schools, hospitals, universities and local authority portfolios can use a consistent digital record of their buildings. The model can support BIM design coordination, clash detection and updates to facilities-management databases.
For retrofit schemes, a thermal overlay can help identify heat-loss paths, giving energy managers evidence to assess potential insulation measures and prioritise further investigation.
Facilities managers can use as-built geometry to check proposed works against the existing building, helping reduce avoidable rework and support compliance with building regulations.
Our Aerial Survey for Architects guide explains how architects can import a 3D model into Revit, overlay design proposals and review potential clashes.
Estate teams may also use model elements in asset registers. Walls, roof sections and service routes can be tagged with identifiers to support condition surveys and maintenance planning.
For heritage projects, a high-density point cloud can record intricate stonework in detail, helping inform conservation work and preserve a digital record of the building’s visible features.
Scope, limitations and commissioning considerations
Before agreeing a commission, decide which deliverables you need: a raw point cloud, 2-D CAD drawings or a full BIM model. Each option affects processing time and cost.
Ask about the required level of detail (LOD). LOD 1 provides a mass model, LOD 2 adds basic walls and roofs, LOD 3 adds detailed exterior features such as openings, and LOD 4 adds interior spaces. Heritage work often needs a higher level of detail than the LOD labels alone describe.
Consider access constraints. Drone operations may be restricted by airspace rules, proximity to airports and other site-specific conditions, and permissions may be required. Interior laser scanning also depends on clear sight lines; cluttered rooms may need scans from multiple positions.
Our survey team prepares a risk assessment and method statement before any flight, covering site-specific hazards and the relevant CAA requirements.
A 3D survey cannot see through solid walls or deep cavities. If hidden services need to be located, combine the survey with targeted investigations appropriate to the building and project.
Pricing varies according to building size, complexity and required outputs. A clear brief, including the preferred coordinate system (OSGB36 or a project grid) and any heritage constraints, helps us prepare an accurate quotation.
For thermal work, ask for evidence that the method and equipment are suitable for the reporting you need: building-fabric thermography is usually reported against BS EN 13187, while IEC 62446-3 applies to solar PV arrays. Confirm that drone operators meet applicable CAA requirements and hold appropriate insurance.
Frequently asked questions about 3D building surveys
What does a 3D building survey actually deliver?
A survey provides a registered point cloud, optional 2-D CAD drawings and, if requested, a BIM model containing geometry. A thermal heat map can also be included where it is required and specified.
How accurate are the measurements?
Room-scale accuracy may be in the range of 1 to 3 mm, while some whole-building surveys specify tolerances around ±5 mm. Actual results depend on the method and project conditions; check the survey specification and accuracy statement.
Can a 3D survey replace a traditional measured building survey?
It can provide measured geometry for many purposes, but it does not assess building condition or reveal hidden defects. A separate condition survey or targeted investigation is needed for those aspects.
Do I need a drone licence to get a survey?
You do not need to hold a drone qualification as the client. The operator must meet applicable CAA requirements and have appropriate insurance; our team arranges this for UK projects.
Is the thermal data compliant with standards?
Thermal imaging should follow the standard that fits the subject. For building fabric that is usually BS EN 13187; IEC 62446-3 covers solar PV arrays. Ask which standard the report will reference.
How long does a survey take?
Capture may be completed in a day for many buildings, while processing and delivery often take one to two weeks. Timescales depend on building access, project size and the selected deliverables.
To discuss a thermal-enabled 3D model for your building, contact Visual Perspectives Limited with your project brief. We can advise on the survey scope and provide a tailored quote to support design, retrofit and asset-management decisions.