Visual Perspectives Limited provides managed drone‑based aerial inspections for commercial roofs and façades across the UK. Thermal drone surveys can spot hidden heat loss, moisture, and structural issues on commercial roofs before they turn into costly repairs. The market still sees many firms hide their fees, but a clear process lets you get reliable data and actionable recommendations. In this guide we’ll walk you through every step, from setting goals to turning thermal images into decarbonisation decisions, so you can protect assets, cut energy waste, and stay compliant.
Step 1: Define Survey Goals and Scope
Before you launch a drone, you need a solid plan. Ask yourself what you want to know. Is it moisture behind a flat roof membrane? Or heat loss through a pitched roof that feeds your building’s heating system? Write those questions down and rank them by risk. High‑risk items, like water‑infiltration that can corrode steel supports, should drive the flight path.
Next, map the building’s footprint. Pull the latest CAD or BIM model, or use a simple site plan from the facilities team. Mark zones that need extra attention: solar PV arrays, skylights, roof penetrations, and any known problem areas. By linking each zone to a specific goal, you create a clear brief for the pilot and the thermographer.
Consider the timing of the survey. For moisture detection, late‑afternoon or just after sunset works best because wet insulation stays warm while the surrounding roof cools. For heat‑loss checks, a cool night after a warm day gives the biggest temperature contrast. Align the flight window with these thermal‑contrast windows to maximise the data quality.
Budgeting is also part of scope. Visual Perspectives offers a bespoke service, so discuss the number of flight passes, resolution needed, and reporting depth. A typical commercial roof may need 2‑3 passes at 5‑cm ground sample distance (GSD) to capture fine‑scale defects.
Finally, set deliverable expectations. Do you need a 3‑D model, a thermal orthomosaic, a defect‑diagnostic report, or all three? Knowing the end‑product helps you choose the right drone and processing software later.
Step 2: Choose the Right Drone and Thermal Camera
The heart of any survey is the platform. For commercial roofs you want a drone that can carry a high‑resolution thermal sensor and fly long enough to cover large spans. A high‑resolution thermal drone platform is a popular choice because it balances payload, flight time, and ruggedness. It also integrates with most processing tools, making data hand‑off smoother.
When picking a camera, look beyond resolution. You need a sensor that can detect temperature differences as small as 0.1 °C. This sensitivity lets you see subtle moisture pockets that a lower‑grade camera would miss. A high‑resolution thermal camera is an example of a sensor that meets that spec and is approved for UK commercial use.
Don’t forget the lens. A narrower field‑of‑view lens gives better detail on distant roof sections, while a wider lens captures broader context. Most thermal lenses are fixed‑focus, so you’ll set focus at infinity and let the software handle stitching.
Check the drone’s compliance with the UK Civil Aviation Authority (CAA). The CAA requires operators to have a Permission for Commercial Operations (PfCO) or the newer Operational Authorisation under Part‑OPS. The CAA website lists the exact paperwork you’ll need, including risk assessments for flights over populated areas.
To keep the workflow smooth, match the drone to the processing platform you plan to use. Visual Perspectives Limited works well with a compatible processing platform, which can ingest both RGB and thermal feeds, plan automated flight paths, and generate IEC 62446‑compatible reports. Processing platform documentation details the supported drone models and camera types.
Finally, verify insurance coverage. A £5 million policy, like the one Visual Perspectives Limited holds, protects you against liability if a drone incident occurs during the survey.
Step 3: Execute a Safe, CAA‑Compliant Flight
With the brief and hardware locked in, it’s time to fly. Start by filing a flight plan with the CAA if you’re operating beyond visual line of sight (BVLOS) or near an aerodrome. Include the GPS waypoints, altitude, and contingency routes in case of sudden weather changes.
Perform a pre‑flight checklist. Verify battery levels, calibrate the compass, and test the thermal camera’s temperature calibration using a known reference, such as a blackbody panel. A quick sanity check helps avoid drift in the thermal data later.
During the flight, maintain a safe altitude, typically 30‑50 m above the roof, to balance ground sample distance and obstacle avoidance. Keep the drone within line of sight if you lack BVLOS approval. Use the automated flight path feature in the mission planning software to ensure 80‑% image overlap, which is critical for stitching accurate orthomosaics.
Monitor weather closely. Wind speeds above 15 km/h can cause motion blur, and rain will corrupt thermal readings. If conditions shift, abort and reschedule. Safety of people on the ground and the drone itself is important.
After the last pass, land the drone on a stable surface away from the building edge. Download the raw RGB and thermal files immediately to a secure laptop. Back‑up the data to an encrypted drive before beginning any processing.
Step 4: Process Data and Generate IEC 62446 Reports
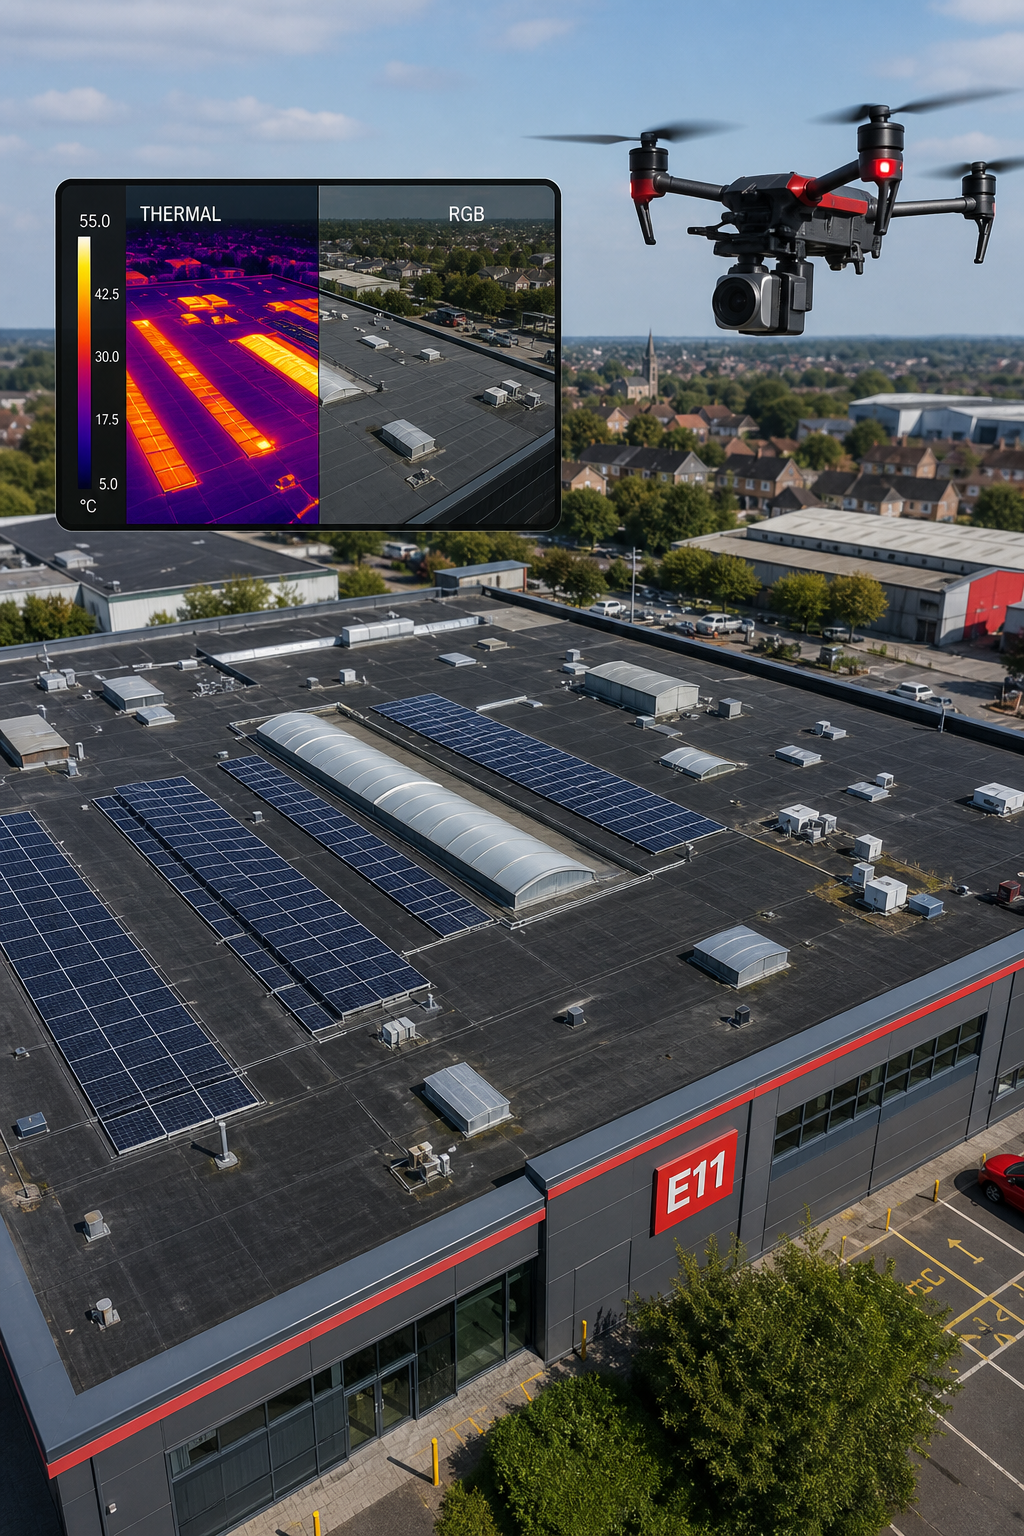
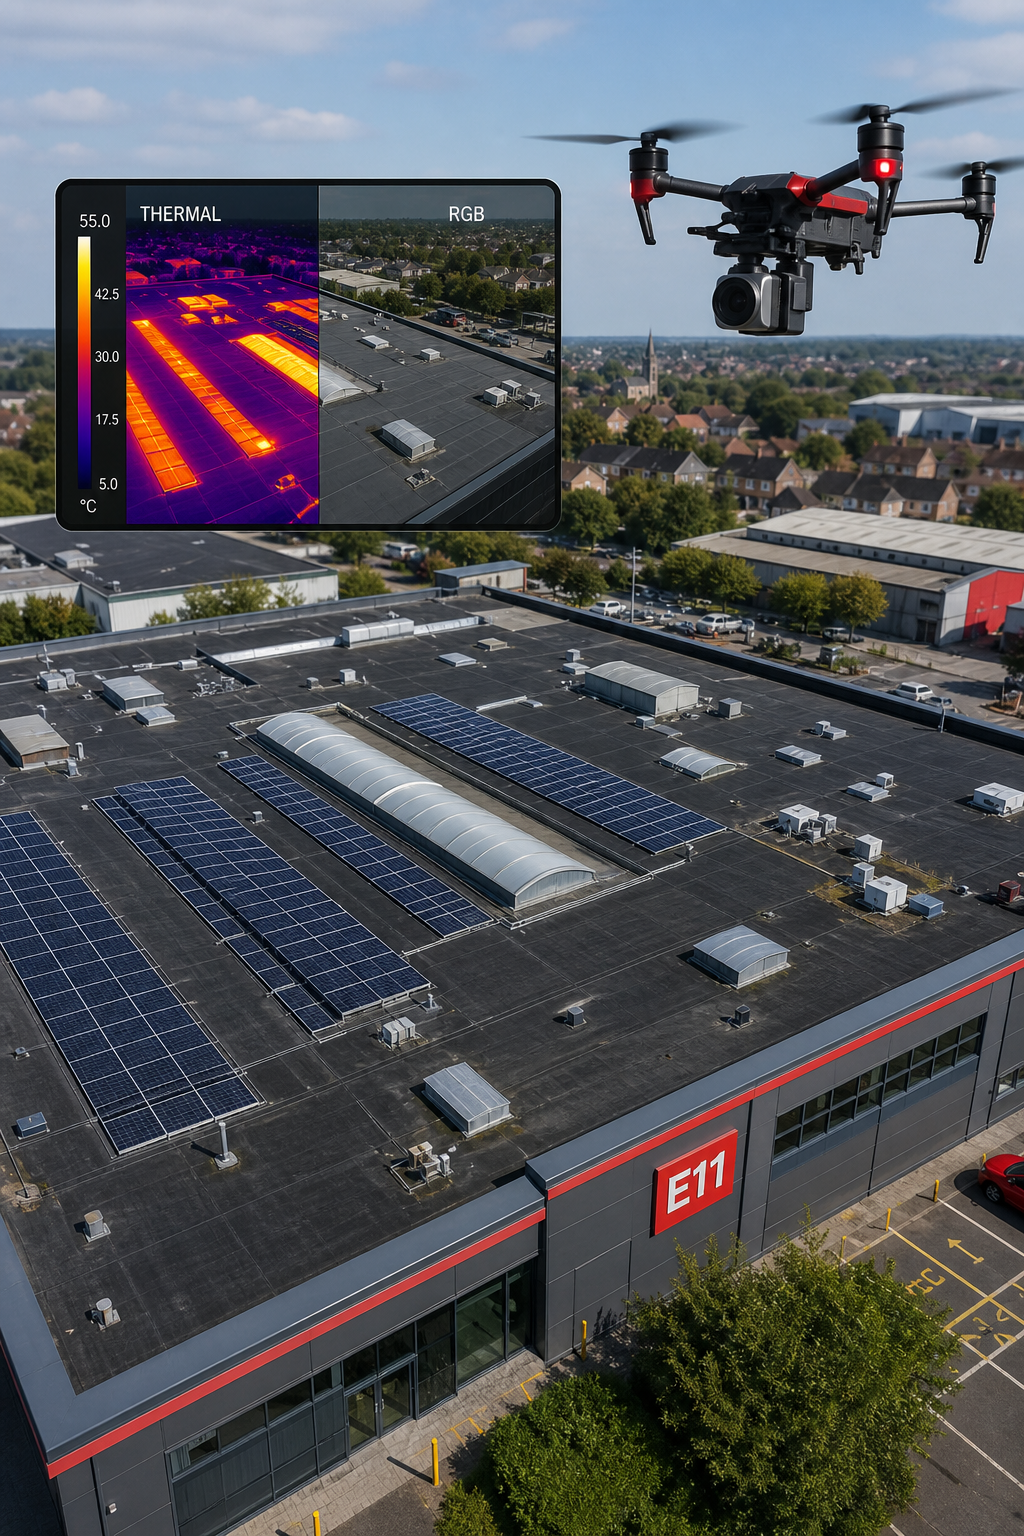
Raw images are only half the story. The next stage is turning them into a usable report that meets IEC 62446 standards. Start by importing the RGB and thermal files into your processing software. For detailed guidance, see our drone roof survey guide. The processing software can automatically align the two datasets, creating a thermal overlay that matches the visual orthomosaic.
Run an AI‑driven defect detection pass. The software flags temperature anomalies that exceed a user‑defined threshold, usually a 5 °C delta for moisture or a 10 °C delta for heat loss. Review each flag manually; AI can miss context, such as a rooftop vent that naturally runs hot.
Generate a 3‑D model of the roof using the RGB data. The model helps you visualize defect locations in three dimensions, making it easier for facilities managers to plan repairs. Export the model in .obj or .las format for use in BIM tools.
Now compile the IEC 62446 report. This includes a cover page, a summary of flight parameters, a heat‑map legend, and a defect register. Each defect entry lists the GPS coordinate, temperature reading, likely cause (e.g., moisture, insulation gap), and recommended remediation.
For compliance, reference the official IEC 62446 documentation. The standard outlines required content, test methods, and reporting formats. ISO’s page for IEC 62446 provides the most up‑to‑date specification.
Once the report is complete, share it via a secure client portal. Visual Perspectives offers a white‑label portal that lets you control branding while giving stakeholders instant access to the data.
Step 5: Analyse Results and Drive Decarbonisation Decisions
With the IEC 62446 report in hand, you can start turning data into action. First, prioritize defects based on risk and energy impact. Moisture‑laden insulation not only threatens structural integrity but also reduces thermal resistance, leading to higher heating demand.
Use the temperature differentials to estimate heat‑loss magnitude. A 10 °C hotspot on a poorly insulated roof section can translate to a 15‑25 % increase in heating costs for that zone, according to industry studies. Target those zones for insulation upgrades or roof repairs to achieve quick energy savings.
Combine the defect register with your building’s energy‑management system (EMS). Feed the locations of high‑loss areas into the EMS to adjust heating set‑points or trigger automated alerts when temperatures rise unexpectedly.
Document each remediation step in a maintenance log. Over time you’ll build a performance baseline that shows how each fix reduces heat loss, supporting decarbonisation reporting for ESG metrics.
For large portfolios, consider a heat‑loss heat map that visualises the most energy‑intensive roofs across all sites. This visual tool helps senior management allocate budget where it will cut the most carbon.
Below is a simple decision matrix you can adapt for each defect. It aligns the severity, cost, and expected carbon reduction.
By tackling high‑severity issues first, you maximize carbon savings while staying within budget.
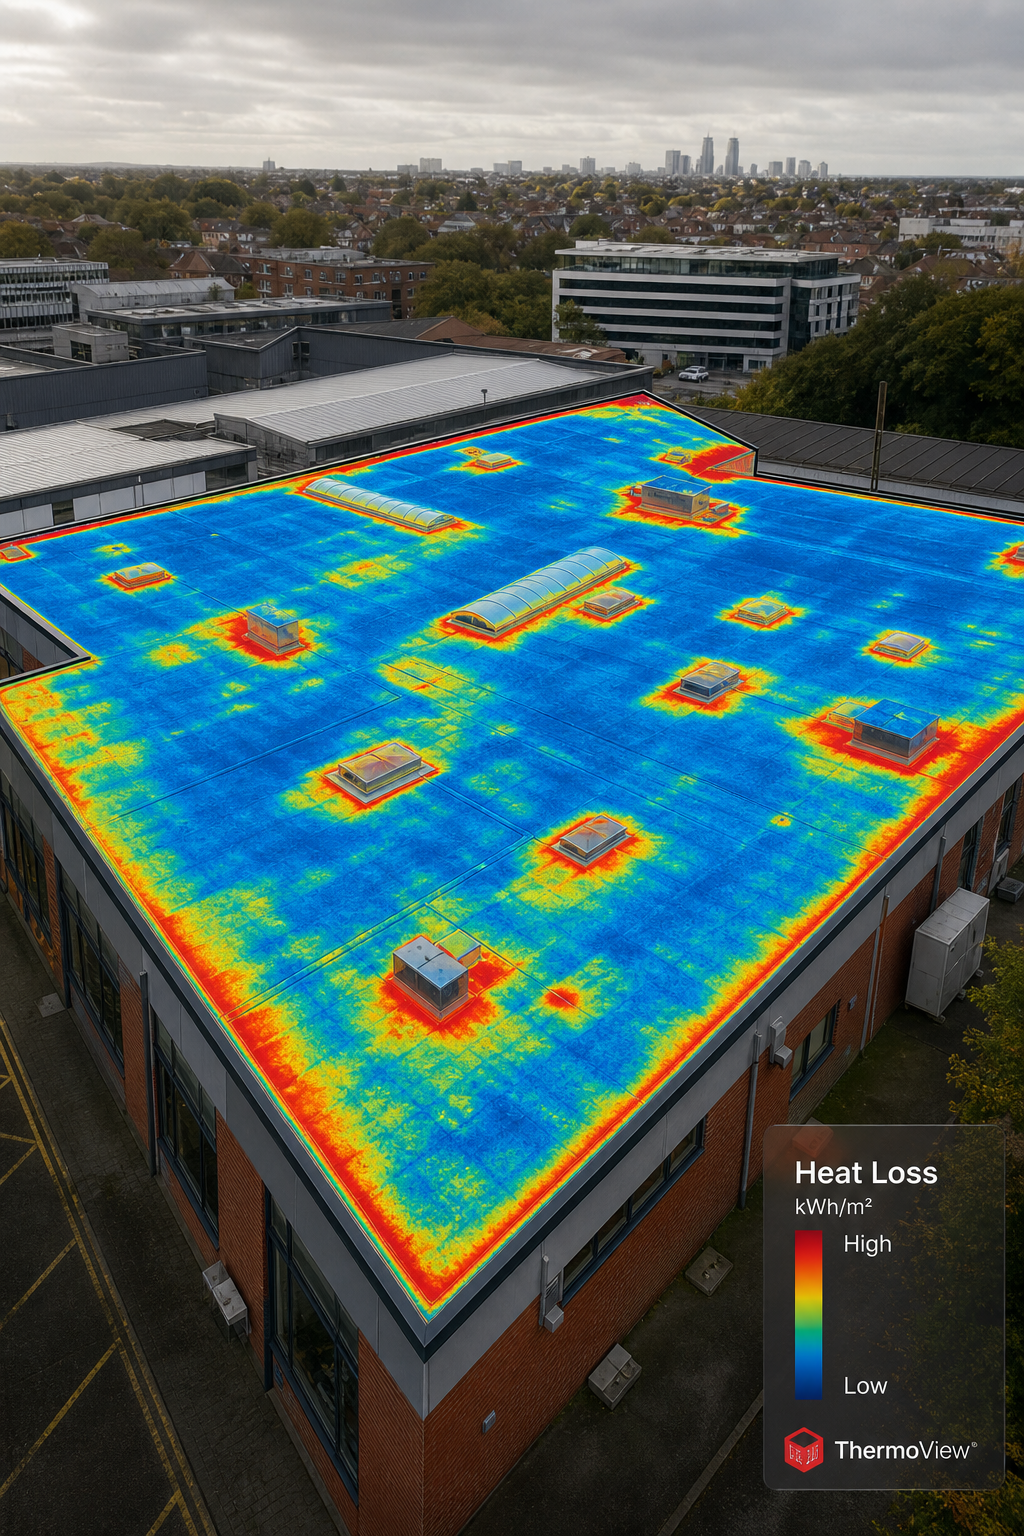
“Thermal imaging turned a vague energy‑loss concern into a specific, actionable plan for our portfolio,” says a senior energy manager at a UK university.
FAQ
What is the ideal time of day for a thermal roof survey?
The best window is shortly after sunset on a clear night. The roof surface cools quickly, but moisture‑laden insulation retains heat, creating a clear temperature contrast that highlights hidden water.
Do I need a special licence to fly a thermal drone in the UK?
Yes. Commercial drone operators must hold a CAA Operational Authorisation (formerly PfCO). The authorisation covers the aircraft type, the operating area, and the intended use, such as building inspections.
How accurate are thermal cameras for detecting moisture?
High‑end thermal sensors can detect temperature differences as small as 0.1 °C. In practice, a 3‑5 °C hotspot often indicates light moisture, while an 8‑15 °C hotspot points to heavy saturation. Calibration against a known reference improves reliability.
What does IEC 62446 compliance mean for my project?
IEC 62446 defines how to test, document, and maintain grid‑connected photovoltaic systems. For a thermal drone survey it ensures the report includes flight details, equipment specs, and defect classification in a format recognised worldwide, which is especially useful for insurance and ESG reporting.
Can the thermal data be integrated with BIM models?
Absolutely. Export the 3‑D model and thermal orthomosaic as compatible formats (e.g., .obj for geometry and GeoTIFF for thermal layers). Import them into BIM software to overlay defect locations on building components, making it easy for engineers to plan repairs.
How does a thermal drone survey help decarbonisation?
By pinpointing heat‑loss hotspots, the survey shows exactly where insulation upgrades will cut heating demand. Reducing heating load directly lowers CO₂ emissions, helping you meet ESG targets and comply with UK net‑zero policies.
What if I have multiple sites across the country?
Use a cloud‑based portal like the one Visual Perspectives offers. It aggregates data from all flights, lets you compare heat‑loss maps side‑by‑side, and generates a consolidated report for portfolio‑level decision making.
How long does it take to get the final report?
From flight to final IEC 62446‑compliant report, most commercial projects take 5‑7 days. Faster turnaround is possible with a dedicated processing team and automated AI analysis.
Conclusion
Running a thermal drone survey for a commercial building is a multi‑step process that starts with clear goals and ends with measurable carbon reductions. By defining the scope, choosing the right platform, flying safely under CAA rules, processing data to IEC 62446 standards, and turning findings into decarbonisation actions, you protect assets and cut energy waste.
Visual Perspectives brings 20 years of experience, ITC Level 1 & 2 thermography credentials, and a £5 million insurance cover to each project. We handle everything from flight planning to actionable reporting, so you can focus on fixing what the naked eye can’t see.
Ready to see the hidden issues on your roof? Reach out to start a survey that’s quickly, precise, and detailed. You’ll be in good hands.