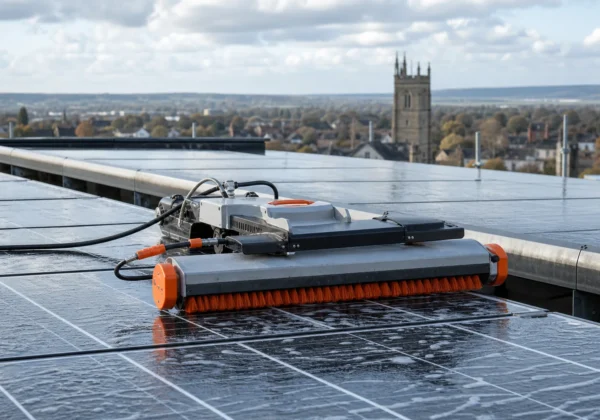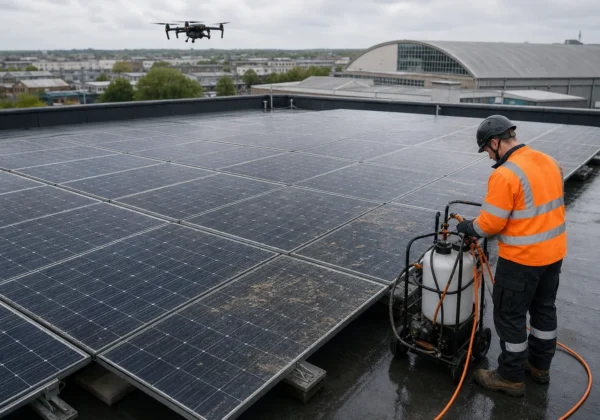
Heat slips out of a building faster than most people notice. That hidden loss drives higher bills, uncomfortable spaces, and higher carbon footprints. In this guide we walk you through every stage of a thermal imaging heat loss survey so you can spot the problem, fix it, and prove the improvement to owners and regulators.
By the end you’ll know how to prep the site, fly a compliant drone, turn raw infrared data into actionable defect reports, and verify that the remedial work actually works. Let’s get started.
Step 1: Pre‑Survey Preparation and Planning
First, lock down the project scope. Ask the building manager which parts of the envelope are most critical, flat roofs, curtain‑wall façades, or solar PV arrays. Write those needs down in a short brief and share it with the drone team. A clear brief stops you from chasing down missing data later.
Next, pick the right thermal camera. Look for a device with an appropriate temperature range, rugged IP‑rating, and one‑hand operation. Leading camera manufacturer guides note that ergonomics and drop‑test ratings matter when you’ll be climbing ladders or crouching in tight roof valleys. The camera should also support the software you plan to use for stitching and reporting, whether that’s the camera’s companion software or an open‑source alternative.
Don’t forget the paperwork. For a commercial survey you’ll need a CAA‑approved operator’s licence, a risk assessment for the flight, and proof of the £5 million public‑liability insurance that Visual Perspectives Limited carries. This paperwork protects you, the client, and the public.
Now schedule the on‑site day. Choose a clear, calm morning when the building’s interior temperature is stable and the sun isn’t heating the façade unevenly. Early‑morning flights give the most contrast between warm leaks and cool background.
Finally, let the client know what they’ll get. A typical deliverable includes a geo‑referenced thermal map, an annotated PDF report, and a spreadsheet of measured temperature differentials. When you promise “quickly, precise, and detailed” data, you’re promising the exact package we deliver at Visual Perspectives Limited.
We’ve got the tools, the licences, and the insurance. You’ll be in good hands.
Step 2: Conducting the Aerial Thermal Scan
On the day of the flight, start with a quick visual walk‑around. Look for obvious damage , cracked tiles, loose panels, or obvious water stains. Those spots will guide where you hover the drone for extra passes.
Launch the drone from a safe, level surface. Keep the flight altitude low enough (usually 15‑30 m) to capture enough pixel detail, but high enough to stay clear of roof penetrations and wind turbulence. Follow the pre‑approved flight path, overlapping each pass by at least 70 % to guarantee a smooth orthomosaic later.
While you’re aloft, switch the thermal camera to radiometric mode. Radiometric data records the exact temperature of each pixel, which is essential for quantitative heat‑loss calculations. Capture both thermal and high‑resolution RGB frames; the visual images help you locate the exact building features behind a hot or cold spot.
Remember to log the GPS coordinates of any unusual readings. That log becomes the backbone of the defect‑identification stage.
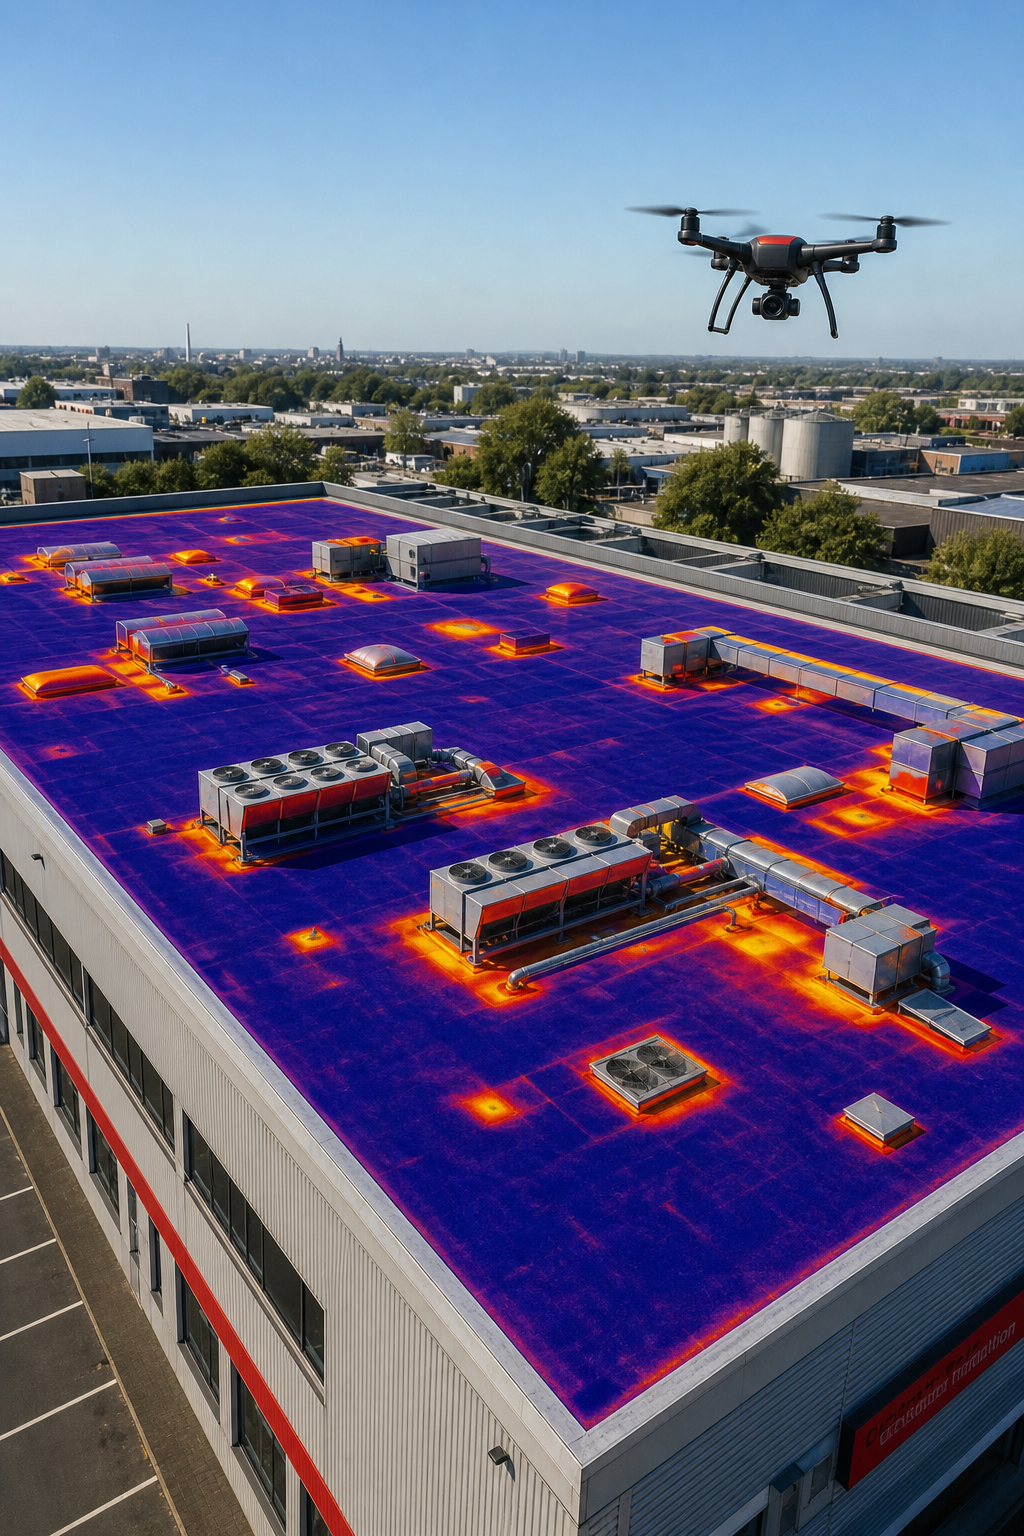
When the flight ends, download the raw data onto a secure laptop. Run a quick quality check , any blurry frames or gaps in coverage need a re‑flight before you leave the site.
Our team at Visual Perspectives runs the same checks on every job, so you never have to wonder if something was missed. You’ll be in good hands.
Step 3: Data Analysis and Defect Identification
Back in the office, stitch the overlapping images into a single orthomosaic. Specialist photogrammetry software can do this automatically, but you’ll still need to align the thermal layer to the RGB base map. Once aligned, set the temperature scale to the building’s indoor set‑point , usually 20 °C for offices , so any deviation stands out.Now hunt for patterns. Cold bridges appear as narrow lines of lower temperature where metal studs or concrete penetrate insulation. Moisture shows up as unusually cool patches that stay cool even as the sun moves across the sky. According to a guide from Oxfordshire County Council, the thermal capacitance difference between wet and dry building materials makes moisture easy to spot in infrared images.
Mark each anomaly directly in the software. Add a note describing the likely cause , “possible roof membrane delamination” or “thermal bridge at window frame”. Export a list of temperature differentials; a delta of more than 5 °C often signals a significant heat‑loss path.
When you finish the analysis, you’ll have a layered map that shows exactly where the building is losing energy. That map is the heart of the report you’ll hand over.
Thermal imaging lets you see what the naked eye can’t see, and the data you generate is ready for the next step , turning pictures into repairs.
Step 4: Reporting and Recommendations
A good report tells a story, not just shows pictures. Start with an executive summary that lists the top three heat‑loss issues, the estimated energy cost impact, and the recommended remediation.
Follow with the full thermal map, annotated with numbered call‑outs that match a table of defects. The table should include: location, description, measured temperature delta, likely cause, suggested fix, and an estimated cost range. When you pair the visual with the numeric data, facilities managers can quickly see ROI.
Make the report IEC 62446‑compliant if solar PV is involved. That standard requires specific sections on module temperature, string‑level performance, and fault detection. Visual Perspectives includes those sections automatically in every commercial PV survey.
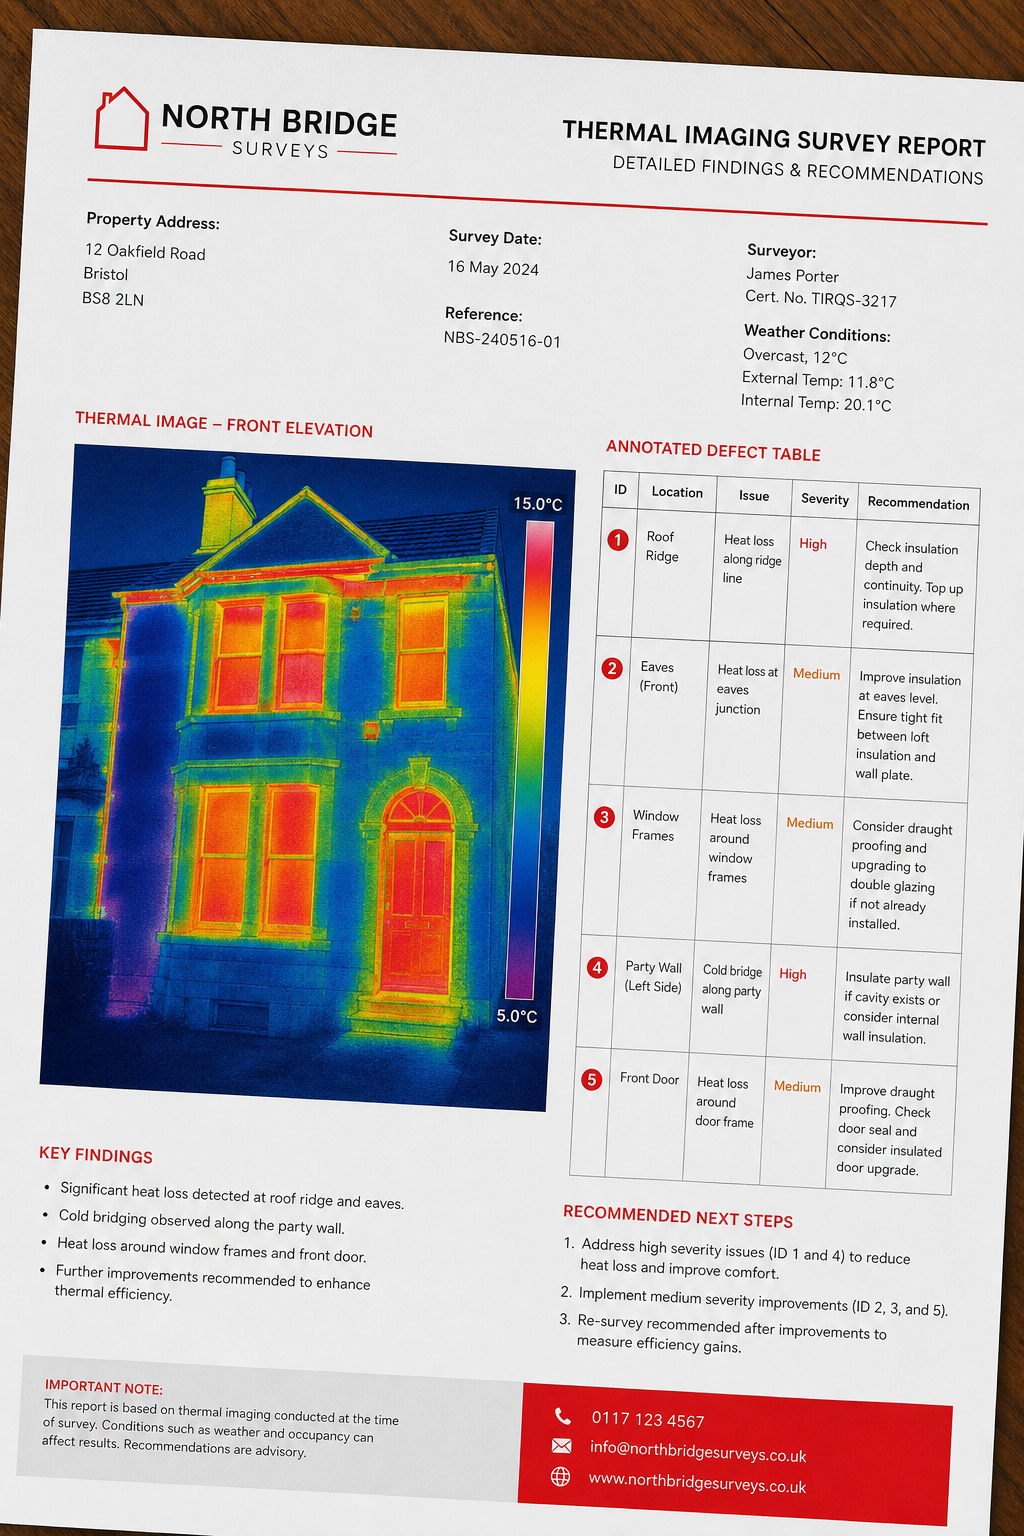
Finally, add a short “next‑steps” checklist. Include items like “schedule roof membrane repair”, “upgrade window glazing”, and “re‑balance HVAC ducts”. This checklist turns the report into an actionable plan.
For a dees, check out our Heat Loss Survey Guide for Commercial Buildings. You’ll see why our clients trust our “quickly, precise, and detailed” approach.
That’s the end of the reporting stage. You’ll be in good hands.
Step 5: Implementing Remedial Actions and Verification
Remediation starts with the client’s maintenance team or a hired contractor. Give them the defect table and the cost‑benefit analysis. Prioritise fixes that reduce the biggest temperature deltas first , usually roof membrane breaches, broken insulation, and thermal bridges at window frames.
After the work is done, schedule a follow‑up drone flight. Run the same thermal scan, but this time compare the new orthomosaic to the baseline map. If the temperature delta has dropped by at least 80 % at the repaired spot, you have a successful fix.
Document the before‑and‑after images side by side in a short addendum to the original report. That addendum serves as proof for insurers, ESG auditors, and building owners.
When you close the loop with clear verification, you not only fix the leak , you also give the client confidence that the money spent really works. You’ll be in good hands.
FAQ
What is a thermal imaging heat loss survey?
A thermal imaging heat loss survey uses infrared cameras, often mounted on a drone, to map temperature differences across a building’s envelope. The map shows where heat escapes, where moisture gathers, and where structural issues may exist. By quantifying those differences you can calculate energy waste and prioritize repairs.
Do I need special permissions to fly a drone for a heat‑loss survey?
Yes. In the UK you must have a CAA‑approved operator’s licence, a specific permission for commercial flights (often called a Permission for Commercial Operations), and a risk assessment that covers the site. Visual Perspectives handles all the paperwork for you, so you can focus on the data.
How accurate are drone‑based thermal measurements compared to handheld cameras?
Drone systems capture higher‑resolution data over larger areas and can maintain a consistent distance from the surface, reducing errors caused by angle or distance. When calibrated correctly, drone‑based thermography can be within ±2 °C of a handheld, certified camera , well within the tolerance needed for energy‑loss calculations.
What standards should the report follow?
For commercial roofs the report should meet ISO 50002 (energy audits) and for solar PV installations it must comply with IEC 62446. Both standards dictate the data you must record, how you present temperature readings, and the documentation required for compliance.
Can a thermal survey detect hidden moisture?
Yes. Moisture changes the thermal capacitance of a material, making it appear cooler than surrounding dry areas under sunlight. Infrared imaging can spot these cool spots early, before mold or structural decay sets in.
How quickly can I get a report after the flight?
Our simplified workflow usually delivers a full, actionable report within 48 hours of data capture. The “quickly, precise, and detailed” promise means you won’t wait weeks for insights.
What if the building has solar panels?
We include IEC 62446‑compliant thermography for PV arrays. That means we measure module temperature, check for hot‑spots, and verify string‑level performance, all in the same flight as the roof survey.
Is a thermal survey worth the cost?
Most of our commercial clients see a 10‑20 % reduction in heating bills after fixing the top‑ranked defects. That savings often pays for the survey within a few months, especially for large facilities with high energy demand.
Conclusion
Running a thermal imaging heat loss survey is a systematic process: prep the site, capture high‑quality aerial data, turn that data into a clear defect map, package the findings in a compliant report, and verify the fixes. When each step is done right, you cut energy waste, lower operating costs, and meet decarbonisation targets.
Visual Perspectives brings 20 years of experience, ITC Level 1 & 2 thermography credentials, and full CAA compliance to every job. Our end‑to‑end service means you don’t need to juggle multiple vendors , we deliver the drone flight, 3D mapping, thermal analysis, and IEC 62446‑ready reporting in one contract.
If you’re ready to see what the naked eye can’t see, explore our Drone Building Inspection – Visual Perspectives page for a full service overview. You’ll be in good hands.