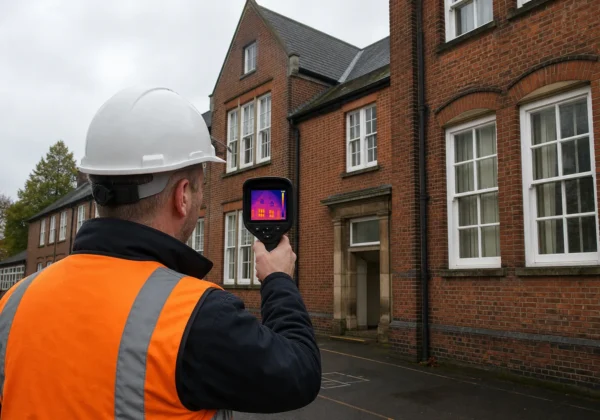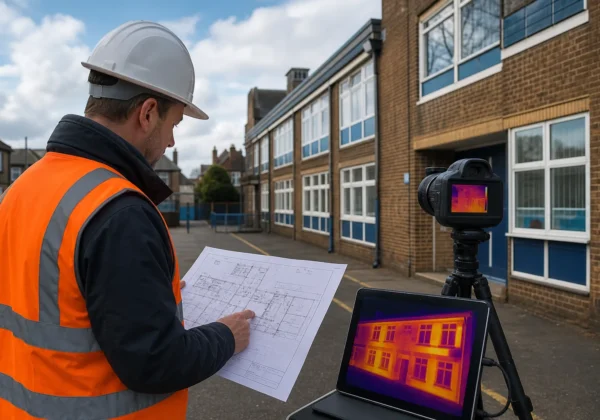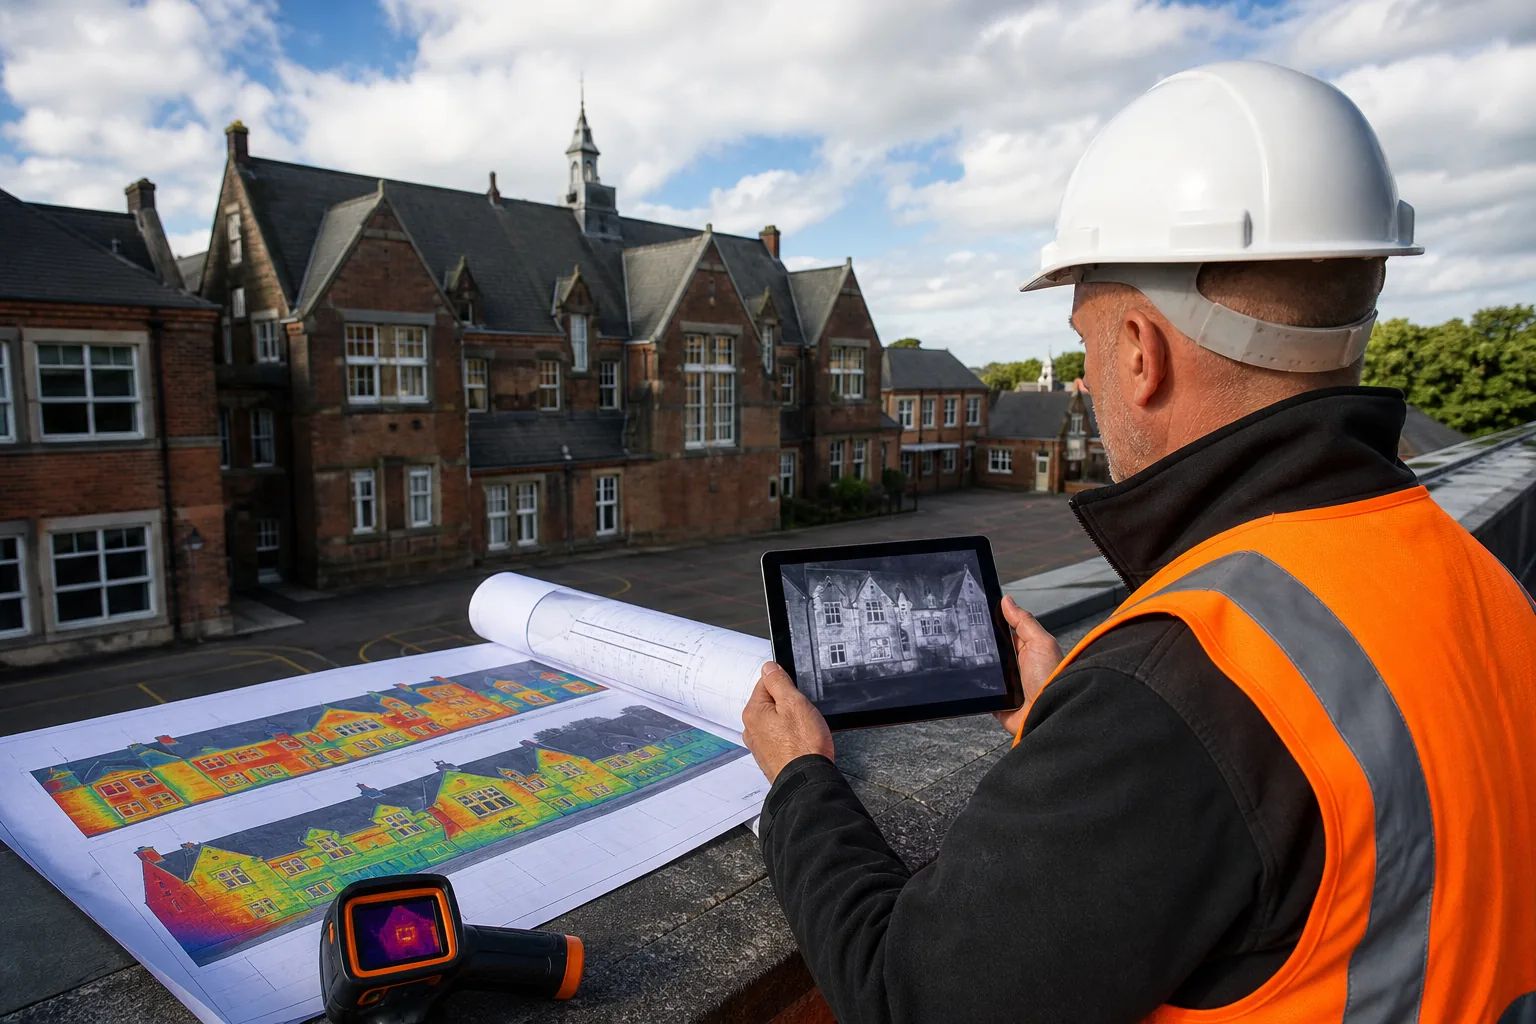
Thermal images can show heat loss, damp areas and insulation gaps, but only when the survey method is sound. A camera image alone doesn’t prove a defect. Use this building fabric thermography checklist to set the scope, control site conditions, inspect the envelope and produce evidence your project team can act on.
Step 1: Define the Survey Scope and Inspection Objectives
A building fabric thermography checklist starts with a clear question. Decide what you need the survey to prove before anyone switches on a thermal camera.
For a school, the question may be why classrooms feel cold beside an external wall. For an NHS estate, it may be whether moisture is entering through a roof zone. A housing association may need evidence of failed cavity insulation before planning remedial work.
Write the objective in plain terms. For example: “Locate likely heat-loss paths across the north elevation” is more useful than “complete a thermal survey”. It gives the surveyor a clear area, a reason and a testable outcome.
Set the site boundary next. List the buildings, elevations, roof areas and internal rooms within scope. Record access limits such as occupied wards, secure areas or roofs that can’t be reached safely from ground level.
Choose the inspection method for the building, not the other way around. A handheld camera may suit an internal room survey. Drone-mounted thermal imaging can help with high façades, large roofs and areas where access would create cost or safety issues.
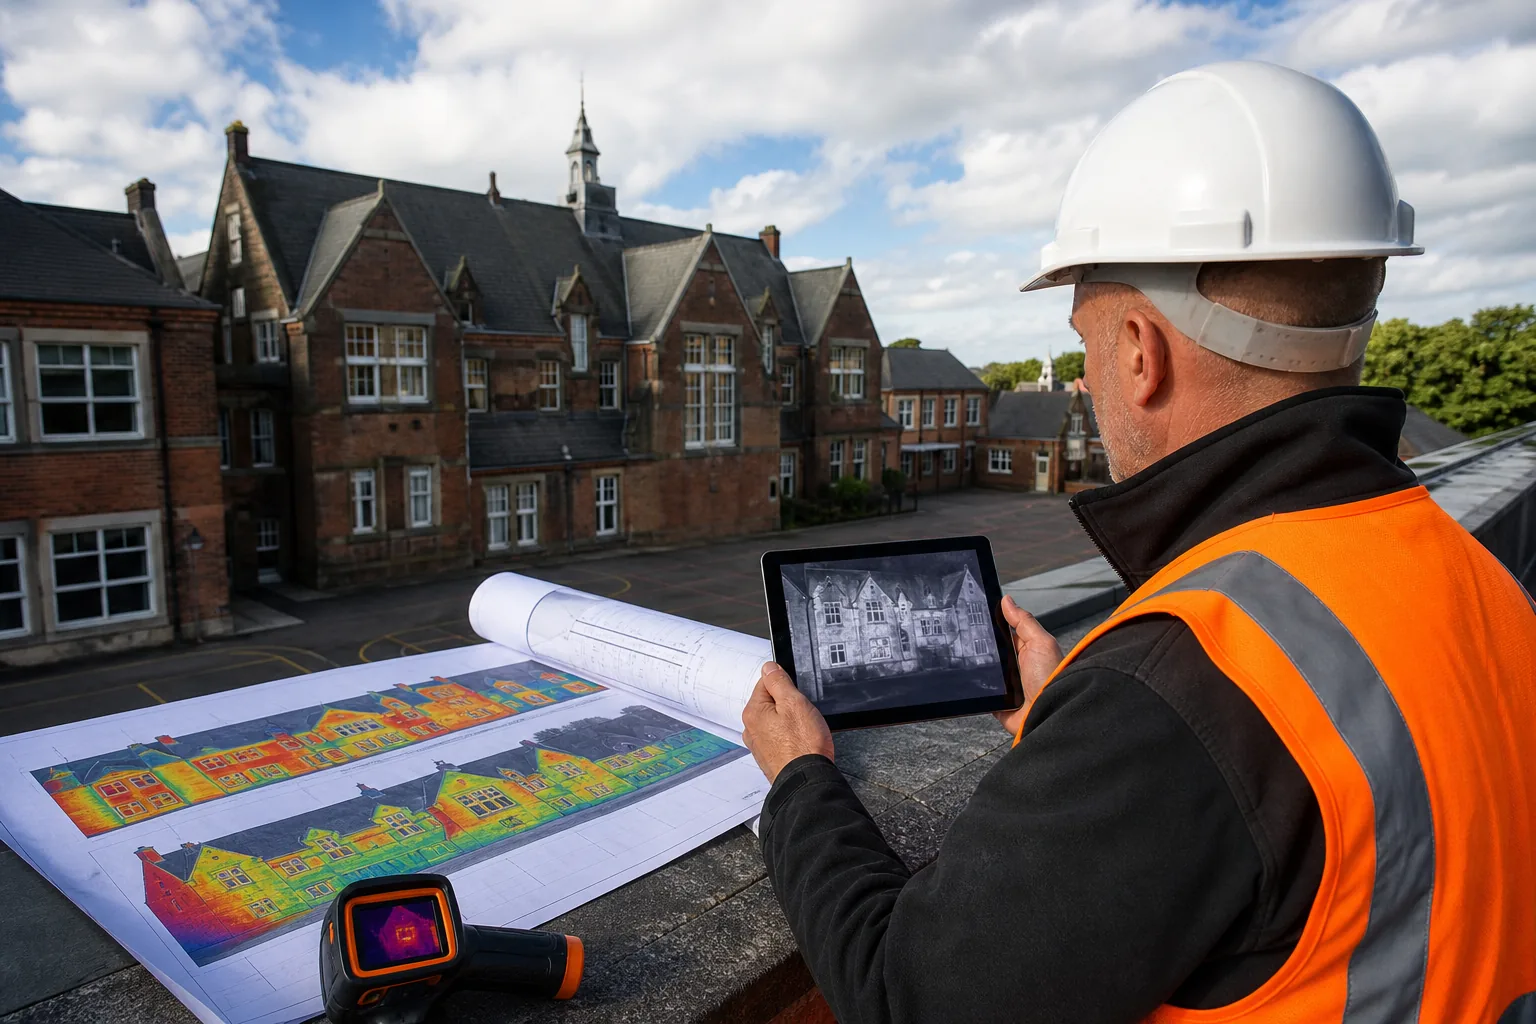
Visual Perspectives Limited uses a dedicated thermal camera with drone-mounted imaging for hard-to-reach building areas. The team can combine thermal evidence with high-resolution aerial inspection and 3D mapping, which gives surveyors a clearer link between a heat pattern and its location.
Use the Building Envelope Diagnostic Checklist: UK Guide when your scope also includes windows, foundations, air leakage or moisture paths. That wider review can stop a thermal symptom being mistaken for the whole defect.
By now you should have:
- A named inspection objective.
- A marked survey area.
- A list of access limits.
- A reason for choosing handheld, internal or drone-based imaging.
That short scope note will guide the site team and make the final report easier to audit. You’ll be in good hands when every image has a clear purpose.
Step 2: Confirm Weather, Building and Equipment Conditions
Reliable thermography depends on conditions before the inspection starts. Check the weather, the building state and the equipment settings as part of the same building fabric thermography checklist.
Thermal imaging measures infrared radiation at a surface. It doesn’t see through walls. A warm patch may point to trapped moisture, a service, solar gain or a change in surface finish. You need site context before calling it a defect.
Record external air temperature, wind, cloud cover and recent rain. Note whether the sun has heated a wall or roof. A sunlit elevation may show a strong pattern that disappears later, while wind can cool exposed corners and make air leakage look worse.
Check whether heating and ventilation systems have operated in their normal pattern. If a school has been empty, internal surfaces may not show the same temperature difference as they would during a normal school day. In a hospital, note plant operation and any areas with restricted access.
Look for surface conditions that affect the reading. Standing water, reflective metal, wet render and glossy finishes can mislead the camera. Record the material and, where possible, take a matching visual photograph beside each thermal image.
Use equipment with a suitable temperature range and a known calibration status. Check the focus, thermal scale and emissivity setting. Emissivity describes how well a surface gives off infrared energy. Get it wrong and the displayed temperature may be unreliable.
Don’t set a universal temperature-difference threshold before seeing the site. A fixed ΔT limit can be misleading when construction, exposure and weather vary. Use temperature differences as evidence alongside images, notes, drawings and other inspection results.
By now you should have a short conditions log and a clear record of equipment checks. If the conditions are too weak for a useful reading, postpone the survey rather than produce a colourful but uncertain report.
Step 3: Inspect the Building Envelope Systematically
A building fabric thermography checklist works best when the inspection follows a fixed route. Move around the building in a set order so you don’t leave gaps between elevations or roof zones.
Start with a visual walkover. Look for cracked render, failed pointing, blocked gutters, damaged roof coverings, staining and changes in finish. Mark each observation on a plan or elevation drawing before taking thermal images.
Then scan the building in zones. A useful sequence is:
- North, east, south and west elevations.
- Windows, doors, junctions and corners.
- Roof edges, outlets, plant areas and roof penetrations.
- Internal walls below windows and beside known cold spots.
- Floor edges, ceiling lines and service penetrations.
Keep the camera angle as close to square as access allows. Oblique views can make a wall appear to have a different temperature when the difference comes from reflection or viewing angle. Capture a wide image first, then take a closer image that shows the suspected anomaly.
Cold bridges are areas where heat moves more easily through the building fabric. Common locations include slab edges, lintels, corners and wall-to-roof junctions. A cold line may indicate a design detail rather than damage, so compare it with drawings or a matching location elsewhere.
Moisture needs the same care. Damp materials can show a different thermal response, especially after rain or when evaporation is taking place. Thermal imaging can locate an area worth testing, but moisture readings or opening-up may still be needed to confirm the cause.
Roof inspections deserve a planned grid. Divide a large roof into zones and name each one. This lets the report point to “Zone C, west roof edge” instead of “a cold area on the roof”. For a high or fragile roof, drone inspection may reduce the need for repeated physical access.
Visual Perspectives Limited provides building thermography and drone roof inspections for public-sector estates, commercial buildings and housing. Its approach is quickly, precise, and detailed, while keeping the focus on what the naked eye can’t see.
For a closer look at survey routes and thermal evidence, the Building Envelope Thermography Guide explains how to plan inspections across roofs, walls and windows.
Don’t interpret each image in isolation. Compare repeated details. If every lintel has the same pattern, it may be a construction feature. If one section differs sharply from matching sections, it deserves closer review.
By now you should have a complete image set with matching visual photographs, location references and notes for each suspected anomaly. The next job is to test those findings rather than count them.
Step 4: Record, Verify and Prioritise Thermal Anomalies
Thermal anomalies become useful when you record what they mean, where they are and how certain you are. This is the evidence stage of the building fabric thermography checklist.
Give every finding a reference number. Use the same reference on the thermal image, visual photograph, plan and report table. Record the surface, location, apparent temperature range and nearby conditions. Add a short interpretation, but keep observation separate from diagnosis.
For example, “irregular cool area below the roof outlet” is an observation. “Likely moisture beneath the roof covering” is an interpretation. “Confirm with moisture testing and a roof opening” is the next action. Keeping these apart makes the report easier to defend.
Verify each important anomaly with a second view. Change the angle, compare an adjacent area or inspect the internal face of the same wall. If the pattern disappears when the camera moves, reflection may be involved.
Compare the image with building records. Check roof plans, insulation details, refurbishment notes and previous repairs. A thermal pattern may match a known steel beam, a fire compartment line or a replacement window detail.
Use a simple priority system based on risk and action. One approach is:
- High: evidence suggests active water entry, a major fabric gap or a defect affecting occupied space.
- Medium: the pattern is repeatable but needs another test before repair.
- Low: the pattern appears consistent with design, surface finish or a minor local variation.
Don’t rank a defect by colour alone. A dramatic colour scale can make a small temperature difference look severe. Keep the scale consistent where comparisons matter, and show the measured values beside the image.
The term “heat loss” also needs care. Thermal imaging can show surface temperature patterns linked to heat transfer. It doesn’t by itself calculate whole-building energy use or prove a specific saving after retrofit.
By now you should have a verified anomaly register. It should tell a facilities manager what needs checking first, who should check it and what evidence would close the issue.
Step 5: Turn the Findings into a Defensible Survey Report and Action Plan
A useful report turns thermal images into decisions. The final stage of the building fabric thermography checklist should help an asset manager plan inspection, repair or retrofit work.
Start with a short executive summary. State the buildings surveyed, the purpose, the survey date and the main limitations. Say whether the survey found issues that need urgent confirmation, planned maintenance or no further action.
Describe the method in enough detail for another professional to understand it. Include the camera type, inspection areas, weather conditions, building operating state and any areas that couldn’t be accessed. For drone work, record the flight area and the relationship between aerial imagery and thermal evidence.
Use a consistent finding format:
- Reference number and exact location.
- Visual image beside the thermal image.
- Observed pattern and measured temperature information.
- Likely explanation, stated with the right level of confidence.
- Recommended confirmation test.
- Suggested owner and priority.
Don’t label a finding “failed insulation” when the image only shows a cold patch. Use language such as “possible insulation void, subject to confirmation”. This protects the client from an expensive repair based on a weak assumption.
Link each action to a building decision. A roof anomaly may need moisture testing before a roof replacement plan. A cold bridge at a window reveal may belong in a fabric upgrade package. A damp internal wall may need a leak investigation before any insulation is added.
For public-sector estates, show how the findings support a wider programme. Group issues by building, fabric element and urgency. That lets a decarbonisation manager separate fabric repairs from later heating-system changes. Building fabric first is often a sensible sequence, but the report should show the evidence behind that order.
Where a formal standard applies, name it accurately and state what the inspection does or doesn’t cover. Visual Perspectives Limited’s thermography service is linked to IEC 62446-3 for compliant inspection reporting in its relevant inspection work. That kind of defined reporting route is useful when a project team needs a documented evidence trail.
Keep raw files with the final report. Store original thermal images, visual photographs, flight records where relevant, survey notes and marked-up plans. A compressed image in a presentation may be easy to view, but it shouldn’t be the only record.
The Building Fabric Thermal Survey: A Usable Guide can help connect thermal findings with moisture risk, heat loss assessment and retrofit planning.
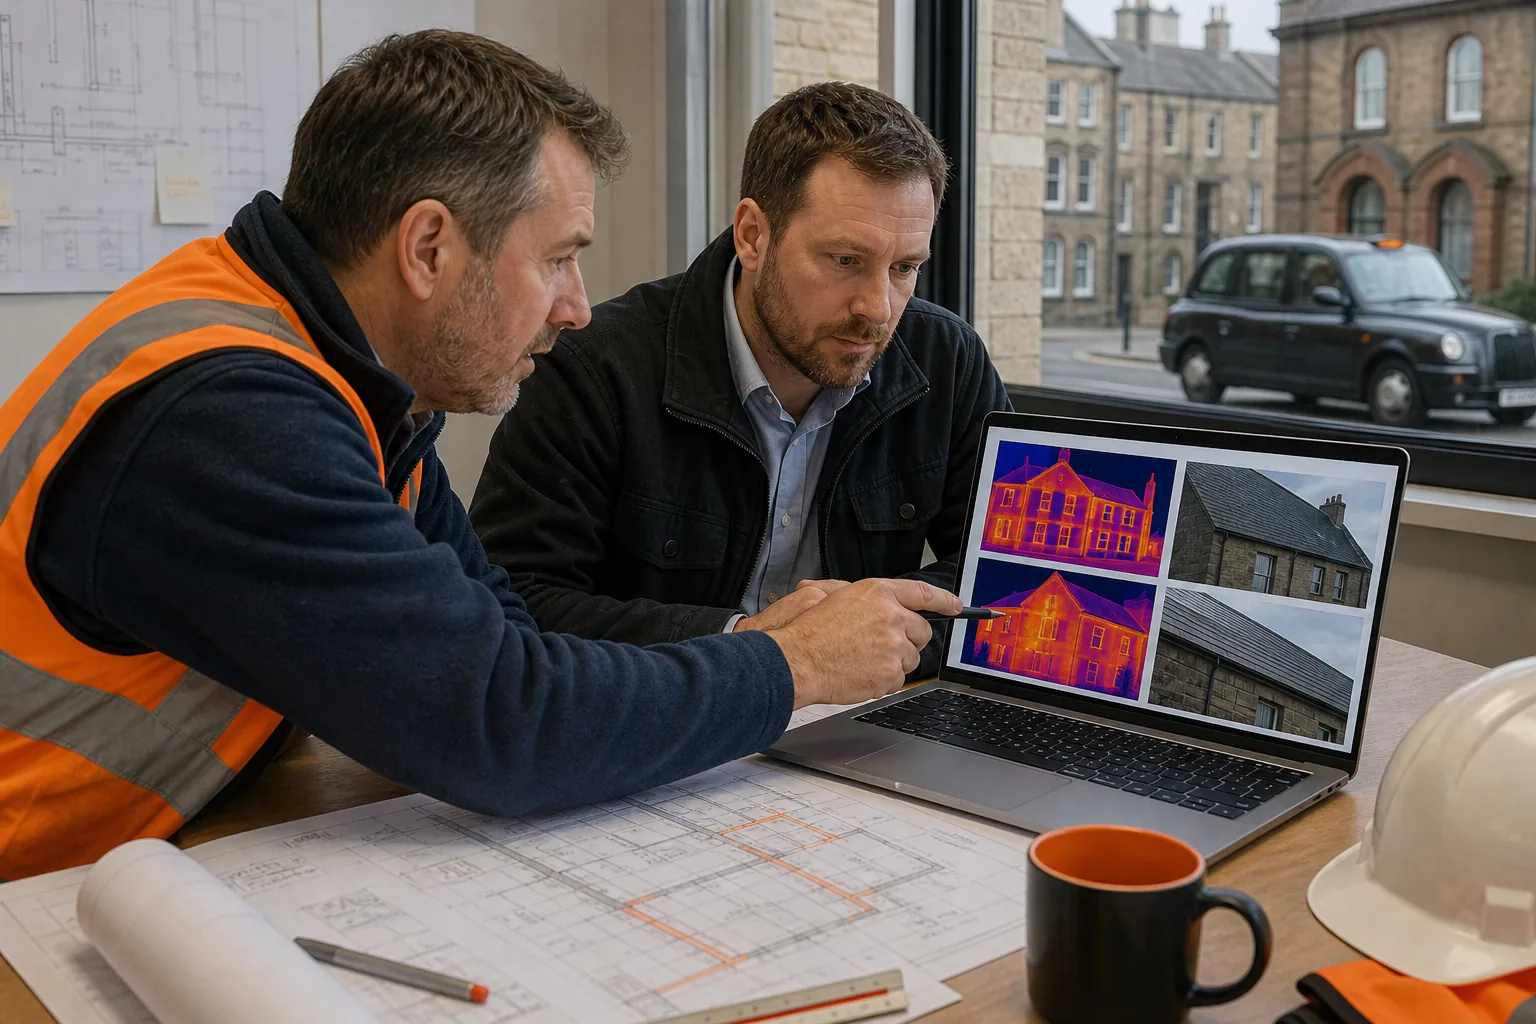
End with a decision register. Each row should have an action, priority, responsible role, proposed timescale and close-out evidence. A report that ends with “investigate further” leaves too much work for the reader. State what investigation is needed and why.
Visual Perspectives Limited works with building surveyors, facilities managers, local authorities, NHS estates, schools and housing organisations across the UK. We provide independent thermal imaging and drone inspection evidence so you can make a better call before committing to remedial or retrofit work.
By now you should have an audit-ready record that can move from surveyor to project manager without losing the location or meaning of each finding. That is the point of the checklist.
FAQ
What is a building fabric thermography checklist?
A building fabric thermography checklist is a set of steps for planning, carrying out and reporting thermal inspections of roofs, walls, windows and internal surfaces. It covers the survey aim, weather, equipment, image records, verification and follow-up actions. It helps you avoid treating a single colourful image as proof of a building defect.
What weather conditions are best for building thermography?
Stable conditions with a useful temperature difference between inside and outside are usually better than rapidly changing weather. Record wind, rain, cloud and recent solar heating before the survey. Avoid drawing firm conclusions from sunlit or wet surfaces without checking matching areas and confirming the suspected defect by another method.
Can thermal imaging find damp in walls?
Thermal imaging can show patterns that may be linked to damp, but it can’t confirm moisture on its own. Wet materials can respond differently from dry materials, yet reflections, air movement and surface finishes can create similar patterns. Use moisture testing, visual inspection or targeted opening-up to confirm the cause.
Is drone thermography suitable for building fabric surveys?
Drone thermography is suitable for some high façades, large roofs and hard-to-reach areas when the flight and inspection conditions are controlled. It can capture thermal evidence without putting a person on a fragile roof. It still needs a clear scope, suitable equipment, competent interpretation and a report that links each image to its location.
Does a thermal survey prove that insulation has failed?
A thermal survey can identify a pattern that is consistent with missing or uneven insulation, but it doesn’t always prove failure. Construction details, moisture, air leakage and internal conditions can produce similar results. Treat the image as evidence for a follow-up check, then confirm the insulation condition before specifying repair work.
Conclusion
Use the checklist to control the survey before you interpret the images. Define the question, record site conditions, inspect by zone and give every anomaly a clear confirmation step. If your estate needs independent evidence for maintenance or decarbonisation planning, Visual Perspectives Limited can help you arrange a quickly, precise, and detailed thermal or drone inspection across the UK.