Visual Perspectives provides managed drone‑based aerial inspections that combine high‑resolution thermal imaging with detailed roof and façade surveys for commercial and public buildings. Thermal imaging reveals hidden defects that can lead to costly repairs and energy loss. This guide explains how the technology works, the value it adds, and how to maximise the benefits of a drone‑based survey. We’ll cover the science, key applications, required standards, and the data you’ll need to keep assets operating efficiently.
Understanding Thermal Imaging Technology for Buildings
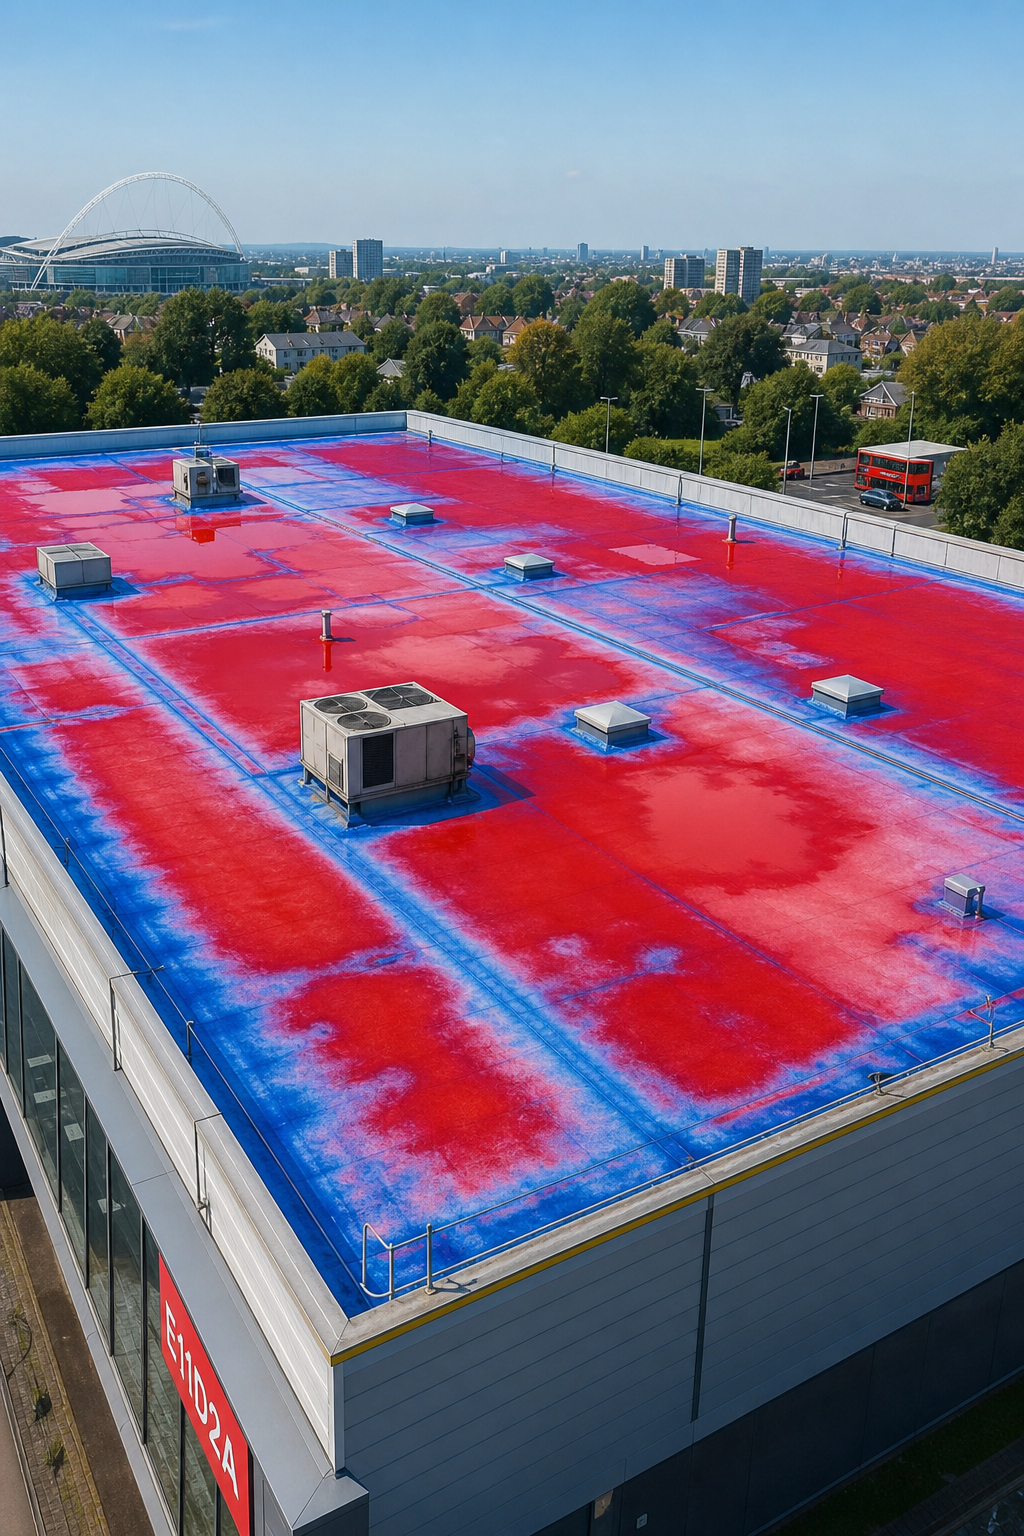
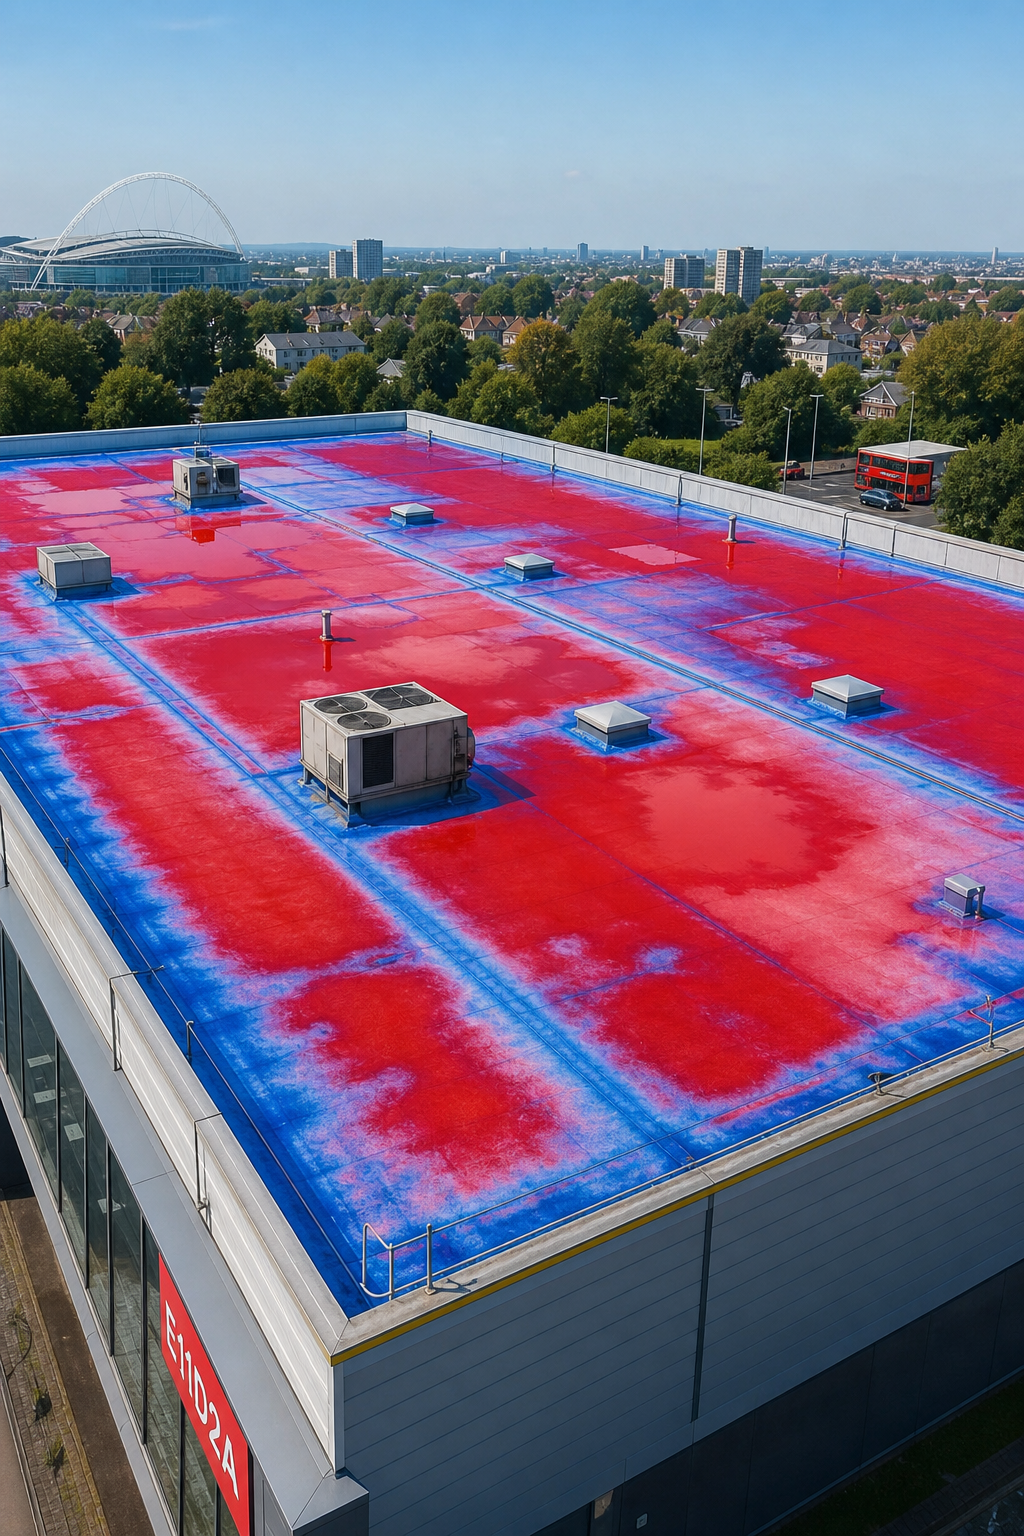
Thermal imaging cameras detect infrared radiation , the heat that every object emits. When a surface is hotter or colder than its surroundings, the camera turns that difference into a colour map. Hot spots appear in bright reds, cold spots in blues. The map lets you see where heat is leaking, where moisture is hiding, or where an electrical connection is overheating.
Modern cameras use a focal‑plane array (FPA) sensor. The higher the pixel count, the more detail you get. A 640 × 480 sensor can spot temperature changes as small as 0.05 °C, which is enough to flag a tiny moisture pocket behind a roof membrane. this resource, and it matches what we see on commercial sites every day.
Why does this matter for you? Because a heat‑loss survey can point out insulation gaps that drive up heating bills. A moisture scan can prevent mould growth that would force a building to close. And an electrical hot‑spot check can stop a fire before it starts.
We at Visual Perspectives have been running drone‑based thermal surveys for two decades. Our pilots hold ITC Level 1 & 2 thermography certificates, and our data pipelines are CAA‑compliant. That means we can fly over a 10‑storey office block, capture 5 cm‑resolution thermal mosaics, and deliver a report that meets the strict IEC 62446 standard for solar PV systems.
When you pair the camera data with a 3‑D model of the roof, you get a “quickly, precise, and detailed” view of every defect. You can see a cold bridge along a wall‑to‑floor junction, track it back to a missing insulation bat, and plan a targeted repair without tearing up the whole façade.
Because the technology is non‑invasive, you avoid scaffolding, ladders, and the downtime that comes with manual inspections. You also get a repeatable baseline , a set of images you can compare year after year to prove compliance, support ESG reporting, or claim warranty work.
Bottom line: the science is solid, the hardware is affordable, and the payoff is real. You’ll be in good hands.
Applications of Thermal Imaging in Commercial Roof & Façade Inspections
Commercial roofs are often large, flat, and hard to reach. Traditional inspections need scaffolding, cherry‑pickers, or dangerous rope access. A drone can fly over the whole surface in minutes, capture high‑resolution RGB photos and thermal data, and stitch them into a single orthomosaic.
One of the most common issues we see is ponding water on flat roofs. Water holds heat longer than dry roofing material, so after a sunny day it shows up as a bright red patch on the thermal map. That patch tells you exactly where the membrane has failed or where a drainage line is blocked.
Another frequent defect is a thermal bridge at a roof‑wall junction. Metal flashings conduct heat out of the building, creating a cold line on the image. Over time that cold line can lead to condensation inside the wall cavity, which then drives mould growth.
Façade inspections benefit from the same approach. Thermal imaging can reveal missing insulation behind cladding, or air‑infiltration gaps around windows. In a recent survey of a university campus, we spotted three separate cold bridges that had been missed in a visual check. The university saved over £30,000 by fixing those gaps before winter.
When you combine the thermal overlay with a 3‑D point cloud, you can tag each anomaly with an exact GPS coordinate. Our field teams then know exactly where to send a maintenance crew, which reduces travel time and prevents unnecessary demolition of healthy roof sections.
That transparency gap can hurt you. If a provider doesn’t list its certifications, you can’t be sure the data meets the standards you need. Visual Perspectives Limited openly shares its ITC Level 1 & 2 qualifications, CAA compliance, and £5 million public‑liability cover.
Our reports also include a heat‑loss calculation that translates temperature differences into estimated energy savings. For a typical retail warehouse, fixing the top five hot spots cut heating demand by 12 % in the first year.
In short, the combination of drone agility, thermal precision, and 3‑D context lets you locate defects quickly, plan repairs precisely, and document everything for compliance. You’ll be in good hands.
How Thermal Imaging Supports Solar PV Thermography (IEC 62446) Inspections
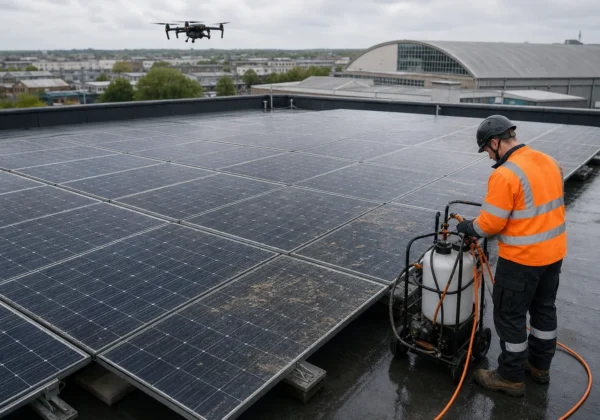
Solar PV arrays on commercial rooftops are high‑value assets. A single hotspot can slash output by 10 % and, if left unchecked, could start a fire. IEC 62446 sets the global benchmark for how to inspect, document, and maintain grid‑connected PV systems.
Our drone carries a radiometric thermal sensor that meets the IEC 62446‑3:2017 requirement of ≥640 × 480 resolution and a temperature accuracy of ±2 °C. The drone flies at a safe altitude, captures a thermal image of every panel, and the software automatically flags any pixel that exceeds the hotspot threshold (usually 2‑3 °C above the module’s normal operating temperature).
After the flight, we run a three‑step process: Survey → Analysis → Reporting. The survey collects the raw images. The analysis applies IEC‑approved algorithms to classify anomalies, hotspots, bypass‑diode failures, cell cracks, or Potential Induced Degradation (PID). The final report includes geotagged images, a defect map, and recommended corrective actions.
Because the report follows IEC 62446, insurers, warranty providers, and EPC contractors accept it without extra verification. That speeds up claim processing and protects the solar investment.
We also offer optional string‑level electrical testing that aligns with IEC 62446‑1:2016. The electrical data is combined with the thermal map, giving you a full picture of both temperature and performance. Visual Perspectives explains the IEC 62446 methodology and why a compliant survey matters for long‑term reliability.
Our team works closely with facilities managers to schedule inspections during the optimal irradiance window, typically >600 W/m² and wind <5 m/s. That ensures the thermal contrast is strong enough for accurate defect detection.
By using drones, we avoid shutting down the PV system. The inspection takes less than an hour for a 5 MW rooftop, and the report is ready within 48 hours. You’ll be in good hands.
Choosing a Drone‑Based Thermal Imaging Service in the UK
When you look for a partner, the first thing to check is compliance. Does the provider hold ITC Level 1 & 2 thermography certificates? Are they CAA‑approved for commercial UAV operations? Do they carry enough public‑liability insurance to protect you if something goes wrong?
Next, compare the hardware. A drone equipped with a 640 × 480 radiometric camera meets most commercial standards, but you should also ask about flight time, navigation accuracy, and obstacle‑avoidance features. Longer flight times mean fewer interruptions, and precise GPS waypoints ensure every panel is covered.
Finally, look at the reporting format. A good service will give you an IEC‑compliant PDF, an interactive web dashboard, and raw data files you can feed into your own BIM or asset‑management system.
Visual Perspectives Limited checks every box. We hold the full suite of certifications, fly with drones that have up to 30‑minute flight times, and deliver a “quickly, precise, and detailed” report that meets IEC 62446 and the UK’s building‑fabric standards.
When you compare quotes, remember that a low price often means fewer certifications or less experienced pilots. A transparent pricing model, like the one we use, shows you exactly what you’re paying for, not hidden fees.
Choosing a partner who backs their work with solid credentials reduces risk and speeds up any insurance or warranty claims. You’ll be in good hands.
Interpreting Thermal Imaging Reports & Data for Asset Management
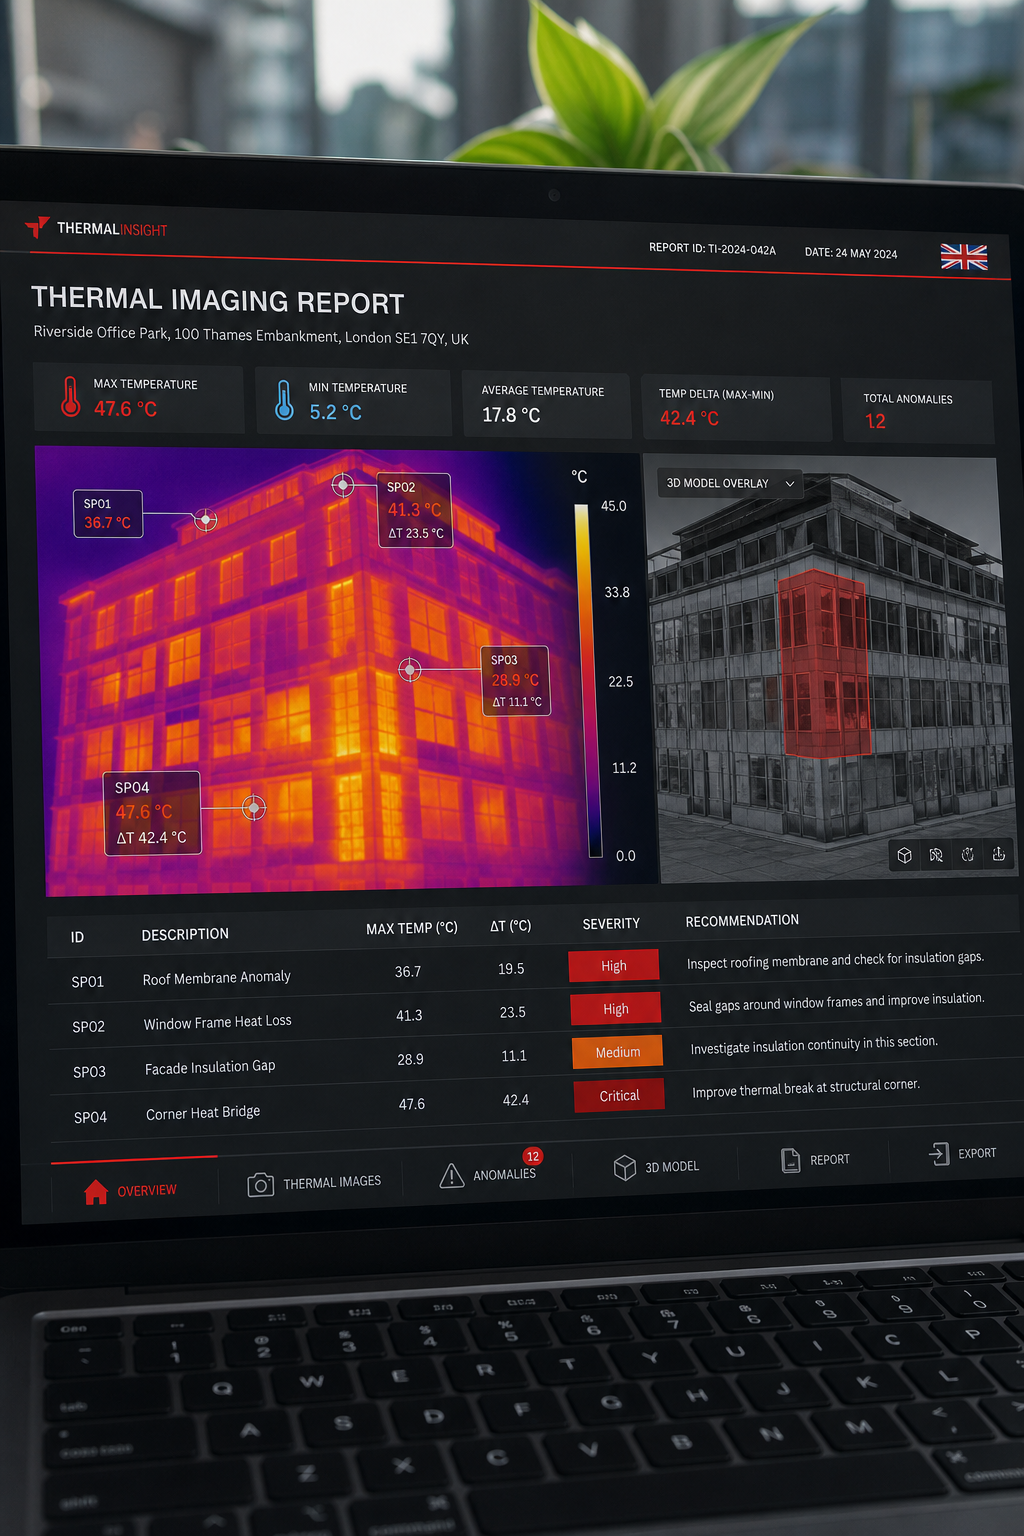
A thermal report is more than a collection of colourful pictures. It’s a data‑driven tool that feeds directly into your asset‑management workflow. The first page usually lists the project details , location, date, drone model, and camera type. That metadata helps you trace the data back to a specific inspection.
Each anomaly is marked with a temperature delta , the difference between the hot spot and the surrounding baseline. A delta of 5 °C on a roof membrane often signals moisture, while a 10 °C delta on a PV module points to a failing cell. The report will also rank defects by severity, so you can prioritize repairs.
Many facilities managers import the thermal data into a CMMS (Computerised Maintenance Management System). The geotagged coordinates let the system generate work orders automatically. For example, a heat‑loss hotspot on a warehouse roof becomes a “Replace insulation at grid X‑Y” ticket. Thermal Imaging Report Explained for Commercial Buildings walks through how to map those tickets in popular CMMS tools.
When you pair the thermal findings with a 3‑D model, you can visualise the defect in context. Imagine a cold bridge that runs along an interior wall. In the 3‑D view you see exactly which floor level the bridge crosses, making it easy to coordinate with the HVAC team.
Another useful metric is the heat‑loss calculation. By integrating the temperature map with surface area data, the software estimates how much energy is escaping. That figure can be used in ESG reporting, to show progress toward net‑zero targets, or to justify capital‑expenditure for insulation upgrades.
Our reports also include a section for recommended next steps. We suggest whether a defect needs immediate repair, a monitored observation, or a deeper investigation with moisture meters or electrical testing. This guidance helps you allocate budget wisely.
By treating thermal imaging as a regular part of your asset‑management cycle , say, once per year for roofs and twice per year for solar arrays , you create a baseline that highlights trends over time. Early‑stage degradation becomes visible before it turns into costly downtime.
Bottom line: a well‑structured report is a roadmap for maintenance, risk reduction, and energy savings. You’ll be in good hands.
FAQ
What types of buildings benefit most from thermal imaging?
Large commercial roofs, flat‑roofed industrial sites, and buildings with extensive solar PV arrays see the biggest returns. The technology can detect heat loss, moisture intrusion, and electrical hot spots that would otherwise stay hidden. By catching these issues early, facilities managers can cut energy bills, avoid downtime, and meet ESG targets.
How often should I schedule a thermal survey?
We recommend an annual roof survey for most commercial properties and a bi‑annual check for solar PV installations. The frequency may increase if you notice sudden energy spikes, after major weather events, or when a warranty deadline approaches. Regular scans create a performance baseline you can compare year over year.
Do drone flights require special permits?
Yes. In the UK, commercial UAV work must be CAA‑approved and the operator needs a Permission for Commercial Operations (PfCO) or the newer General‑VLOS‑C licence. Visual Perspectives Limited holds all required licences, so you don’t need to chase paperwork yourself.
What is IEC 62446 and why does it matter?
IEC 62446 is an international standard that defines how to perform, document, and maintain solar PV thermography inspections. Compliance means your report will be accepted by insurers, warranty providers, and regulatory bodies. It also ensures the data is collected under consistent environmental conditions, giving you reliable results.
Can thermal imaging detect structural damage?
Indirectly, yes. A hot spot can indicate a loose electrical connection that may cause fire, while a cold spot can reveal missing insulation that leads to condensation and later rot. When combined with a 3‑D model, you can see exactly where the defect lies in the building’s structure.
How does the data integrate with existing BIM or CMMS systems?
Our reports include geotagged images, CSV files of temperature deltas, and a BIM‑compatible IFC file that contains the 3‑D point cloud. You can import these directly into a leading BIM software or a CMMS platform, then link each defect to a work order. The process automates tracking and reduces manual entry errors.
What insurance coverage do you provide?
Visual Perspectives Limited carries £5 million public‑liability insurance. That protects both you and us in the unlikely event of an accident during the drone flight or a data breach. The coverage is part of our compliance package, so you don’t need to arrange extra policies.
Is there a way to before committing?
Absolutely. We can share a redacted version of a recent commercial roof survey that shows the layout, thermal overlay, defect classification, and heat‑loss calculations. Seeing the level of detail helps you decide if the service meets your project’s needs.
Conclusion
Thermal imaging for buildings is a proven way to turn invisible heat into actionable insight. Whether you need to spot roof leaks, verify solar panel health, or feed data into an asset‑management system, the combination of drones, high‑resolution infrared cameras, and standards‑based reporting delivers fast, safe, and reliable results.
We at Visual Perspectives bring two decades of experience, full ITC and IEC certifications, CAA‑approved pilots, and £5 million insurance to every project. Our “quickly, precise, and detailed” surveys cut down on manual labour, reduce risk, and help you meet decarbonisation targets.
Ready to see what the naked eye can’t? Get in touch to discuss a tailored thermal imaging plan for your commercial portfolio. You’ll be in good hands.