Visual Perspectives Limited provides managed drone‑based aerial inspections for commercial rooftops, specialising in roof and façade surveys and high‑resolution thermal imaging. Solar panels lose output when something goes wrong on the roof. A faulty cell, a loose connector, or a hidden hot‑spot can shave off a big chunk of the energy you expect, hurting your budget and sustainability goals. In this guide we’ll show how drone‑based inspections uncover hidden problems, how thermal imaging and IEC 62446 keep data trustworthy, and what that means for the efficiency of your commercial PV system. Explore our full range of services.
Understanding Solar Panel Efficiency in Commercial PV Systems
Solar panel efficiency is the ratio of sunlight turned into electricity. In simple terms, it tells you how much power you get out of the area of the panels. For commercial rooftops the numbers matter because you’re often dealing with hundreds of kilowatts of capacity. A panel that runs at 20 % efficiency on a 1 MW array will produce about 200 kW under ideal sunlight; drop the efficiency to 18 % and you lose 20 kW of power every hour of peak sun.
Why does efficiency vary? The type of cell, the amount of sunlight, and temperature all play a role. Monocrystalline cells sit at the top of the chart, delivering 22‑27 % in lab conditions, while polycrystalline cells sit around 15‑22 % and thin‑film modules hover near 15‑22 % but degrade faster.sourceThe real world isn’t a lab: shading, soiling, and faulty connections shave efficiency further.
In a commercial setting you also have to think about the performance ratio (PR). PR compares actual output to the theoretical maximum after accounting for weather and system losses. A healthy commercial system usually posts a PR of 0.78‑0.85. Anything lower hints at hidden issues that need fixing.
Understanding these metrics gives you a baseline. When you add a drone inspection into the mix, you get a visual and thermal map that tells you why the numbers might be slipping. That’s the first step to boosting solar panel efficiency.
How Drone Roof Inspections Identify Efficiency Losses
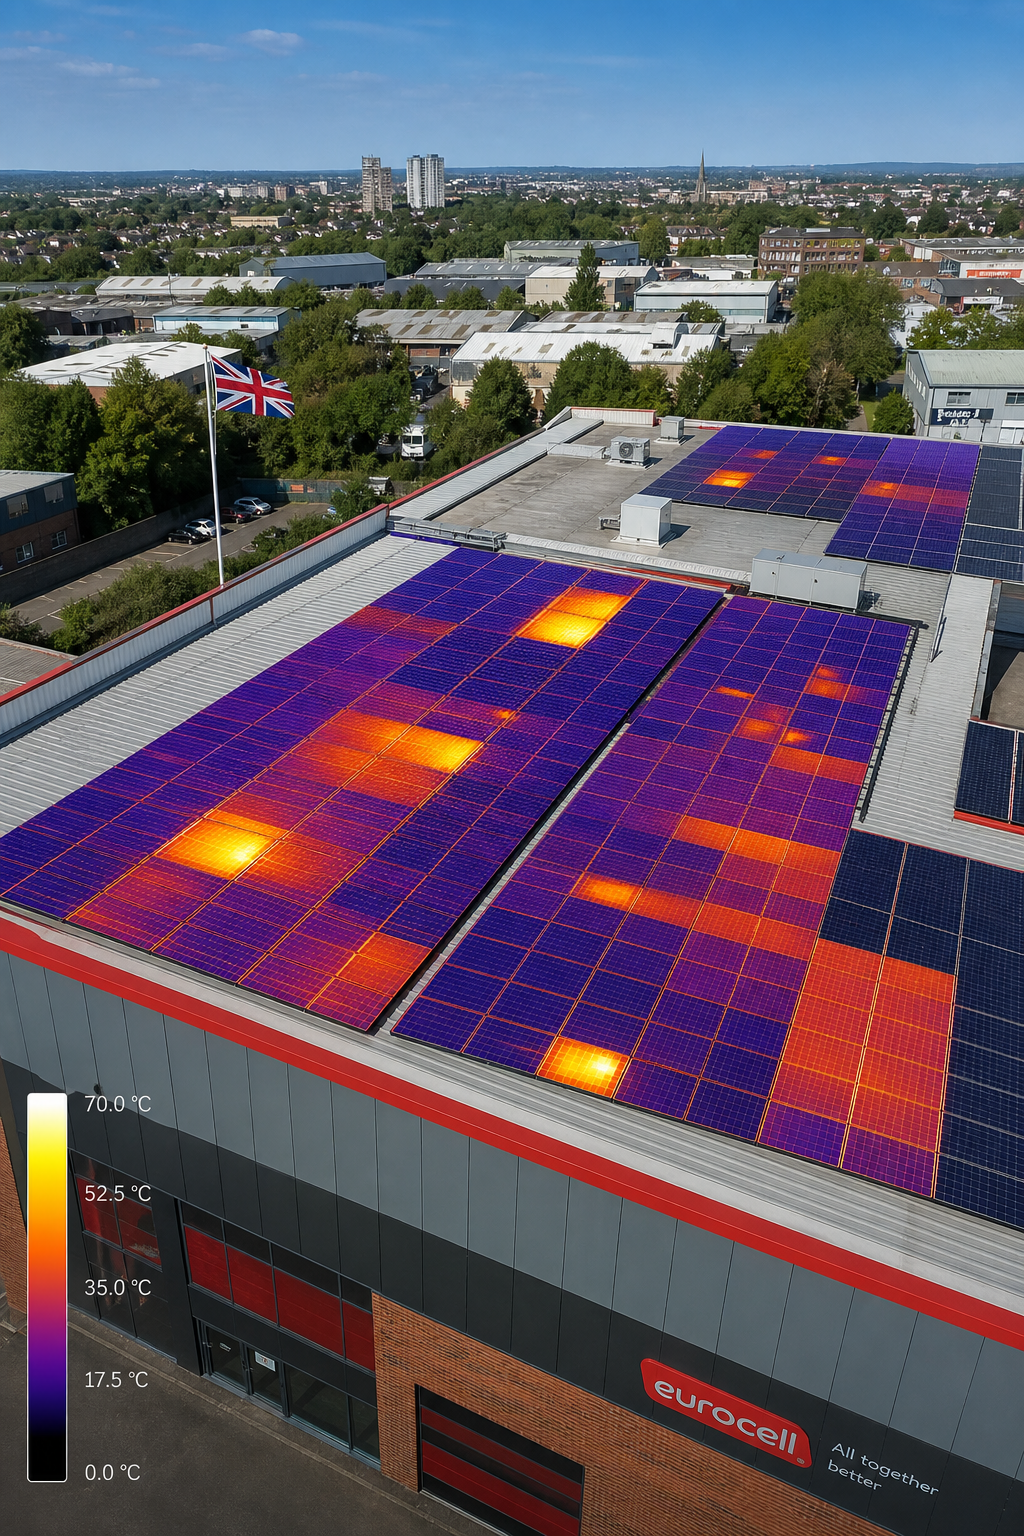
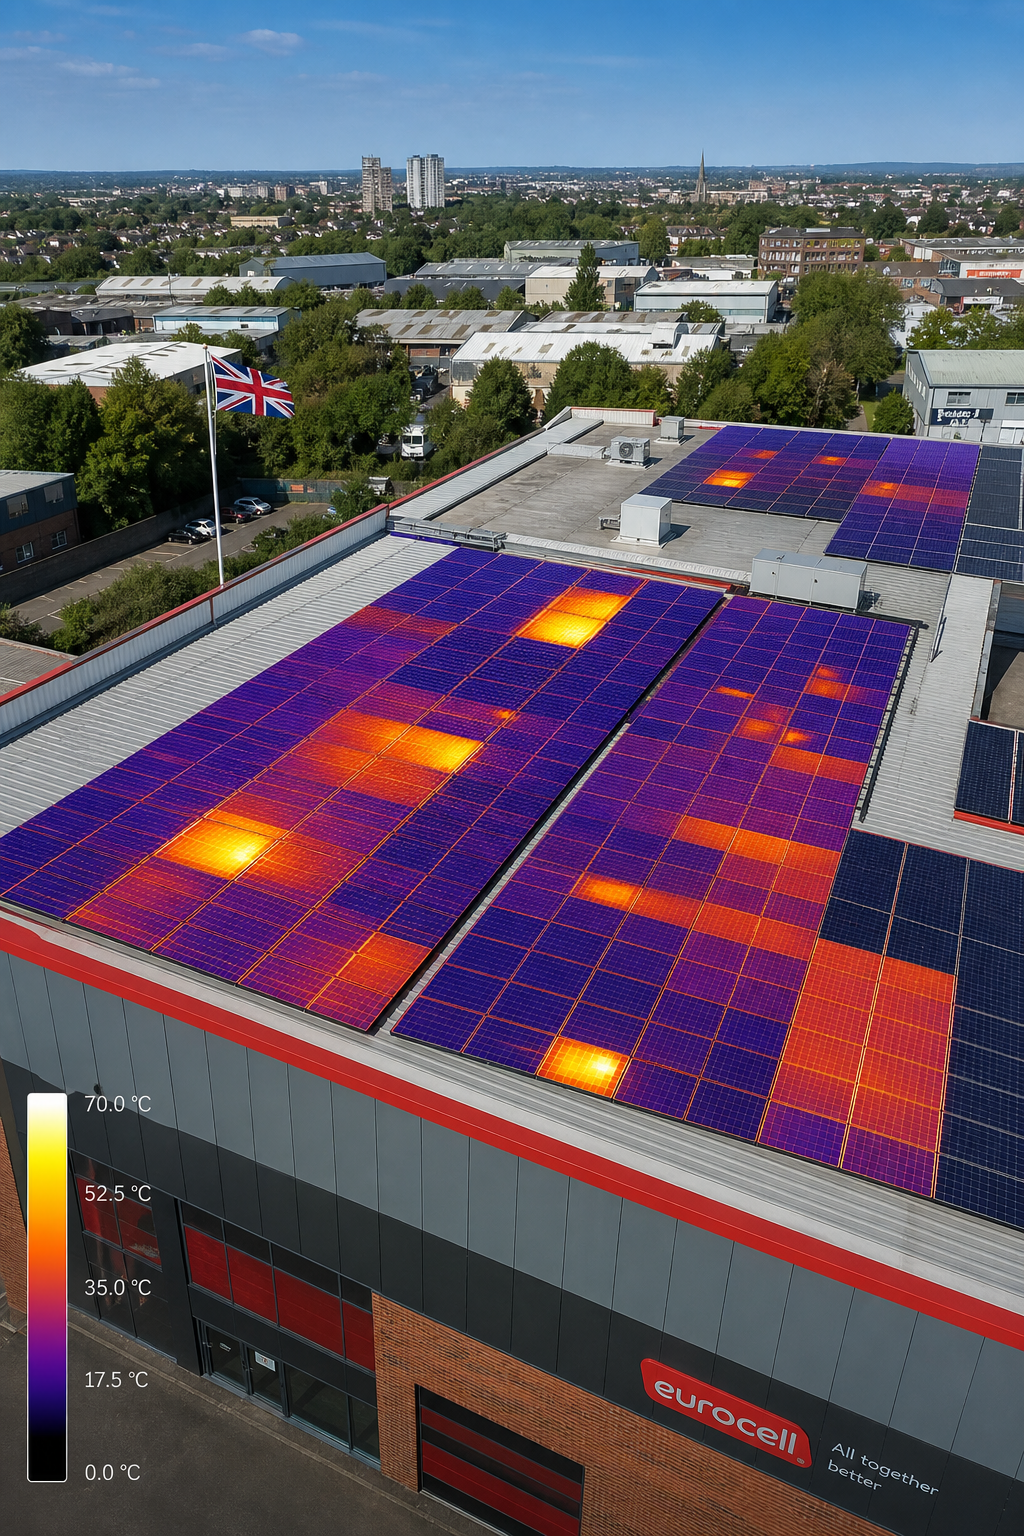
Drones fly over the roof and capture high‑resolution RGB photos and radiometric thermal images in a single flight. The camera spots temperature differences that the naked eye can’t see. A hot‑spot on a panel shows up as a bright red patch in the thermal overlay, indicating a cell that’s drawing too much current or a broken connection.
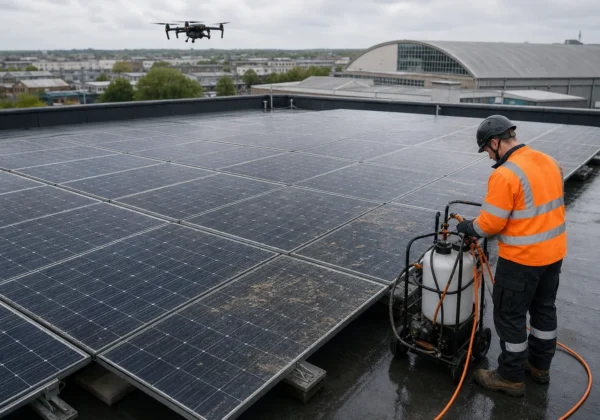
Because the drone never touches the roof, you avoid ladders, scaffolding, and the safety risks that come with manual checks. The whole survey finishes in minutes, even on a sprawling industrial roof. That speed means you can schedule inspections more often, catching issues before they compound.
Thermal data also reveals shading problems. If a nearby HVAC unit casts a shadow at certain times of day, the affected panels will run cooler and produce less power. The drone’s 3‑D model lets you overlay sun‑path analysis to see exactly when and where shading hits.
Here’s a quick look at what the inspection uncovers:
- Hot‑spots from cell damage or bypass diode failure
- Loose or corroded wiring that creates resistance
- Soiling patterns that block sunlight
- Shading from new structures or vegetation growth
- Physical cracks or delamination visible in the visual orthomosaic
All of these factors directly bite into the panel’s conversion rate. By spotting them early, you can schedule repairs, clean panels, or redesign layout to recover lost output.
When you pair the thermal map with the system’s performance data, you get a cause‑and‑effect story. The drone shows a hotspot on panel row 12; the inverter logs a dip in voltage at the same time. That correlation tells you exactly where to send a technician.
You’ll be in good hands knowing the exact fault, not just a vague warning light.
Thermal Imaging & IEC 62446: Ensuring Accurate Efficiency Measurements
Thermal imaging works only if it follows a strict standard. IEC 62446‑3:2017 defines how to conduct a solar PV thermal survey so the results are repeatable and defensible. The standard says you must shoot in clear sky, with at least 600 W/m² solar irradiance, and keep wind below 5 m/s to avoid cooling effects.
Qualified thermographers, Level 3 Master Thermographers in our case, use calibrated infrared cameras with a resolution of at least 640×480 pixels. The camera records the temperature of each panel surface, then software translates that into a thermal map.
Why does IEC 62446 matter for efficiency? Because it forces the survey to capture real operating conditions. If you inspect on a cloudy day, the panels aren’t producing power, so hotspots may be invisible. The standard also mandates a structured Survey → Analysis → Reporting workflow, which gives you a report that includes geotagged images, anomaly classifications, and recommended corrective actions.
When the report meets IEC 62446, insurance companies and warranty providers accept it without question. That means you can claim repairs under warranty faster, saving money and downtime.
Here’s a simple checklist to verify a compliant thermal inspection:
- Check weather conditions: clear sky, >600 W/m² irradiance, low wind.
- Confirm thermographer credentials: Level 3 Master Thermographer.
- Validate camera specs: resolution ≥640×480, calibrated before flight.
- Ensure data is delivered in a structured report with geotags and anomaly tags.
Following this checklist guarantees that the temperature anomalies you see are real performance issues, not measurement artefacts.
Our team at Visual Perspectives follows the IEC 62446 workflow to the letter, giving you data you can trust for performance optimisation and regulatory compliance.Reference
With accurate thermal data, you can prioritize the highest‑impact fixes first, whether it’s tightening a connector or cleaning a heavily soiled section. That focus drives measurable gains in solar panel efficiency.
Benefits of Drone Inspections for Facility Managers
Facility managers juggle budgets, safety, and compliance. Visual Perspectives Limited delivers these drone‑based inspections, combining high‑resolution 3D mapping and thermal imaging for commercial rooftops. Adding a drone inspection to the workflow checks several boxes at once. First, safety improves dramatically. No more sending staff onto steep roofs with ladders; the drone does the work from the ground.
Second, time savings are huge. A manual roof walk can take a full day for a large campus. A drone can capture the whole roof in under an hour and deliver a full report within 72 hours. That rapid turnaround lets you act on faults before they affect the next billing cycle.
Third, cost reduction. You cut labour hours, avoid renting scaffolding, and minimise the risk of accidents that could lead to insurance claims. The upfront cost of a drone survey is often less than a single day of manual labour.
Fourth, documentation. The report includes a 3‑D model, orthomosaic images, and thermal overlays that serve as a legal record of roof condition. This is valuable during warranty disputes, insurance claims, or ESG reporting.
Finally, data integration. Most modern drone platforms let you export the inspection data straight into your CMMS or asset‑management system. That means you can schedule corrective work automatically, track trends over time, and produce KPI dashboards for senior leadership.
Facility managers who adopt drone inspections report smoother audit cycles and clearer ROI on their solar assets. You’ll be in good hands knowing the roof health is documented, safe, and cost‑effective.
Data‑Driven Decision Making: Interpreting Inspection Reports
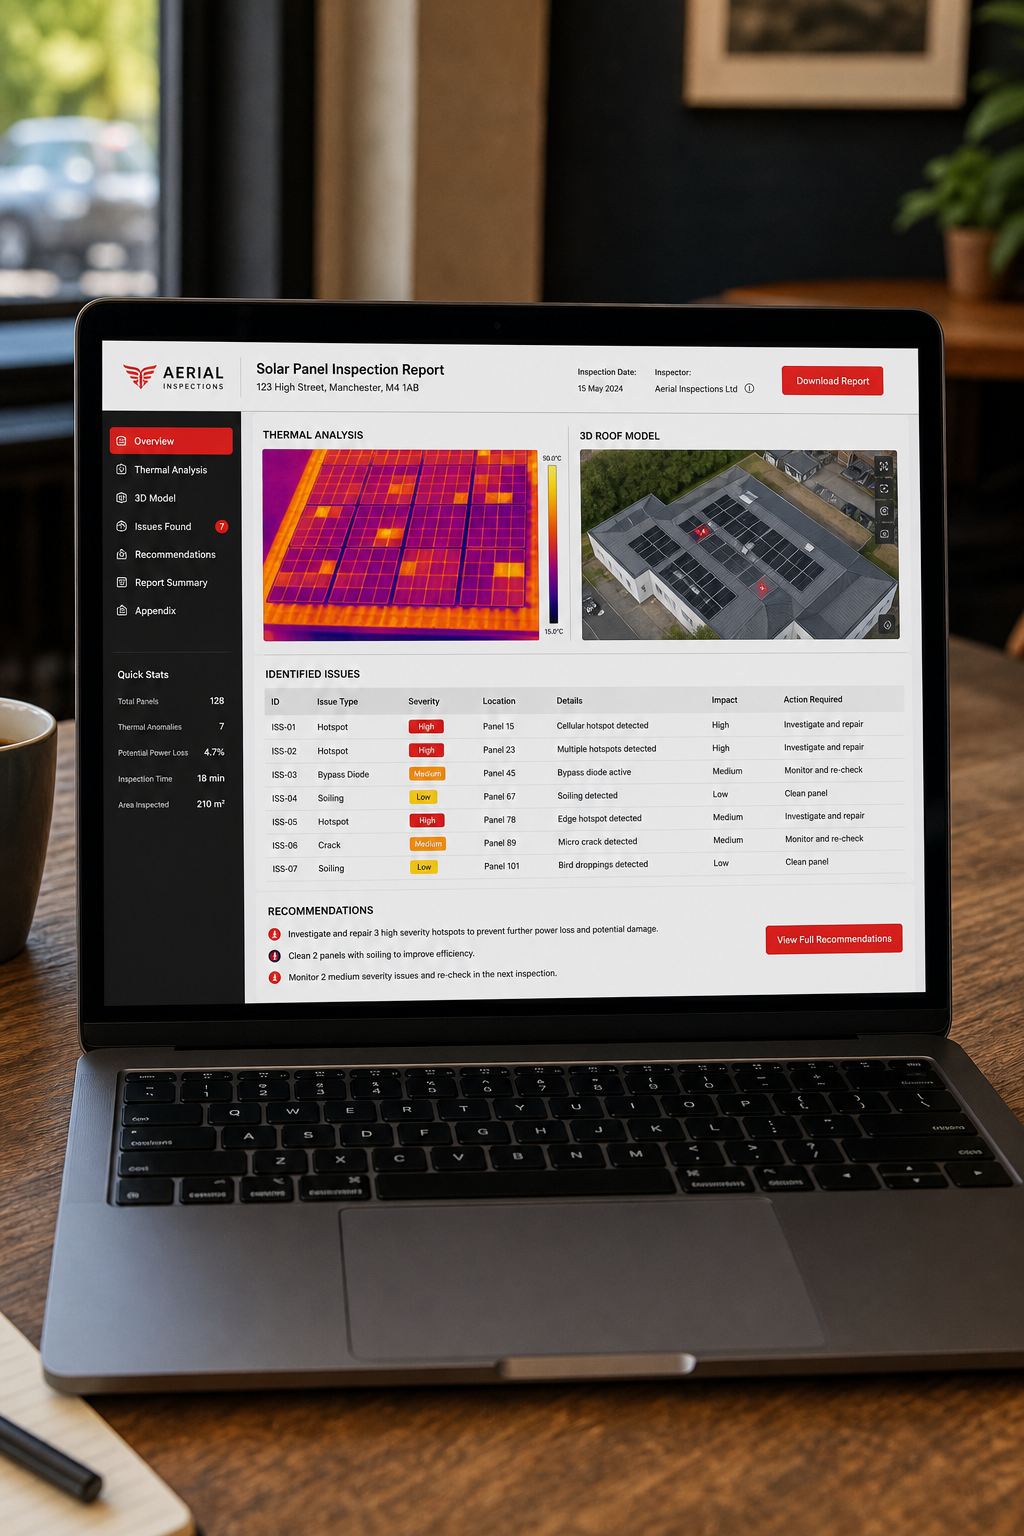
The raw images and thermal maps are only useful if you can turn them into actions. Visual Perspectives Limited’s inspection report does three things: it highlights anomalies, it ranks them by impact, and it recommends next steps.
Hot‑spots are usually the highest‑impact issues. A hotspot that’s 15 °C above ambient can indicate a cell that’s failing or a connector that’s overheating. The report will flag it, show the exact panel location, and suggest a visual check or a string‑level electrical test.
Next on the list are shading and soiling patterns. The report may colour‑code panels that receive less than 80 % of the expected irradiance. Those panels often benefit from cleaning or trimming nearby vegetation.
Finally, structural concerns, cracks, water pooling, or loose mounting, appear in the RGB orthomosaic. The report tags these with severity scores, helping you decide whether a repair can wait or needs immediate attention.
When you feed these recommendations into your maintenance schedule, you close the loop between inspection and performance improvement. Over a year, the cumulative gain can push a system’s PR from 0.78 to 0.84, translating into thousands of extra kilowatt‑hours.
Because the data follows IEC 62446, you can also share the report with insurers or warranty providers without extra validation steps. That smooths the claim process and reduces admin overhead.
In short, Visual Perspectives Limited’s well‑structured report turns raw drone data into a clear action plan that boosts solar panel efficiency and protects your assets.
FAQ
What is the typical accuracy of drone‑based thermal imaging for solar panels?
Thermal cameras calibrated to IEC 62446 standards can detect temperature differences as small as 0.5 °C. That level of precision lets you spot hotspots that would be invisible to the naked eye. In practice, the accuracy translates to identifying panel faults that could cause up to a 15 % drop in output, allowing you to correct them before they affect overall system performance. Visual Perspectives’ calibrated surveys deliver this level of detail on every commercial roof.
How often should a commercial rooftop PV system be inspected with a drone?
Most facility managers schedule a full drone inspection twice a year, once after the winter season to catch frost‑related damage and once before the high‑summer generation peak. In between, you can run a quick visual check if you notice a sudden dip in the performance ratio. The 72‑hour reporting window means you can act quickly on any findings, and Visual Perspectives can provide rapid follow‑up reports when needed.
Do drone inspections work in cloudy or rainy weather?
Thermal imaging needs clear sky and sufficient solar irradiance (at least 600 W/m²) to produce reliable temperature readings. Light clouds are acceptable, but heavy rain or low sun angles can mask hotspots. If the weather doesn’t meet the IEC 62446 criteria, the survey is postponed to the next suitable window to ensure data quality. Visual Perspectives always plans inspections around optimal weather conditions to guarantee accurate results.
Can drone inspections replace all manual roof checks?
Drone surveys cover the majority of visual and thermal inspections, eliminating the need for ladders, scaffolding, or cherry pickers. However, certain tasks, like physically tightening a loose bolt or replacing a damaged module, still require a technician on site. The drone inspection tells you exactly where to go, reducing the time spent on manual checks, and Visual Perspectives coordinates any necessary on‑site interventions.
How does IEC 62446 compliance affect warranty claims?
Most manufacturers and insurers accept IEC 62446‑compliant reports as proof of fault origin. That means you can submit the thermal and visual findings directly to the warranty provider, speeding up claim approval and reducing the risk of a denied claim due to insufficient evidence. Reports generated by Visual Perspectives meet these standards, helping you protect your investment.
What are the cost benefits of using drones versus traditional inspections?
Traditional roof walks can cost several thousand pounds in labour, equipment hire, and safety mitigation. A drone survey typically runs between £200 and £500 for a commercial roof, plus a fixed reporting fee. When you factor in faster issue detection, reduced downtime, and avoided warranty disputes, the ROI often pays for itself within one or two maintenance cycles. Visual Perspectives’ efficient workflow maximises these savings for commercial clients.
Conclusion
Drone roof inspections give you a clear, data‑rich picture of what’s happening on your solar array. By combining high‑resolution visual imagery, radiometric thermal maps, and IEC 62446‑compliant reporting, you turn vague efficiency losses into specific repair orders. That translates into higher performance ratios, lower operating costs, and smoother compliance with insurance and warranty requirements.
Facility managers who adopt this approach see faster turn‑around times, safer work practices, and a stronger business case for ongoing solar investments. Ready to see the hidden issues that are dragging down your solar panel efficiency? Explore our deeper guide on commercial solar panel maintenance to learn how a regular drone‑based thermographic check fits into a year‑round asset‑management plan.
We’ll help you move from guesswork to data‑driven decisions, keeping your rooftop PV system running at peak efficiency while protecting your bottom line.