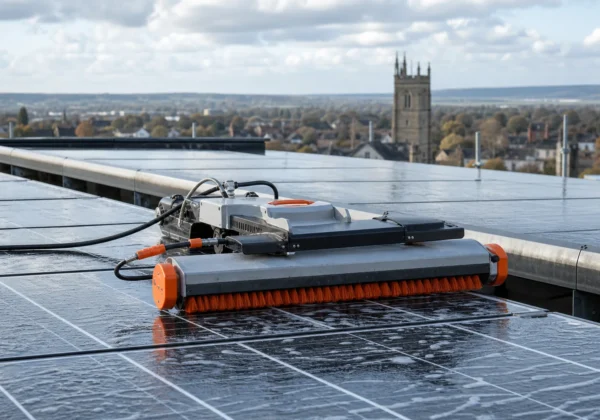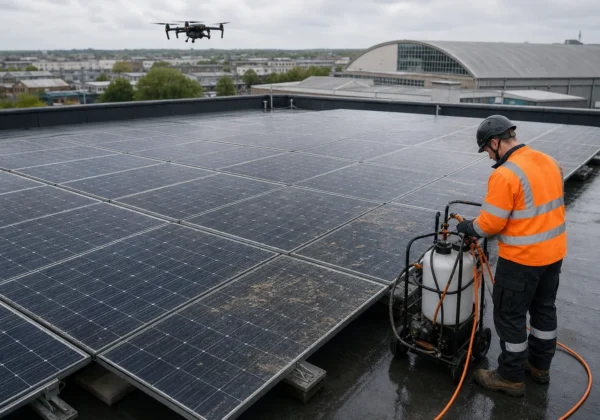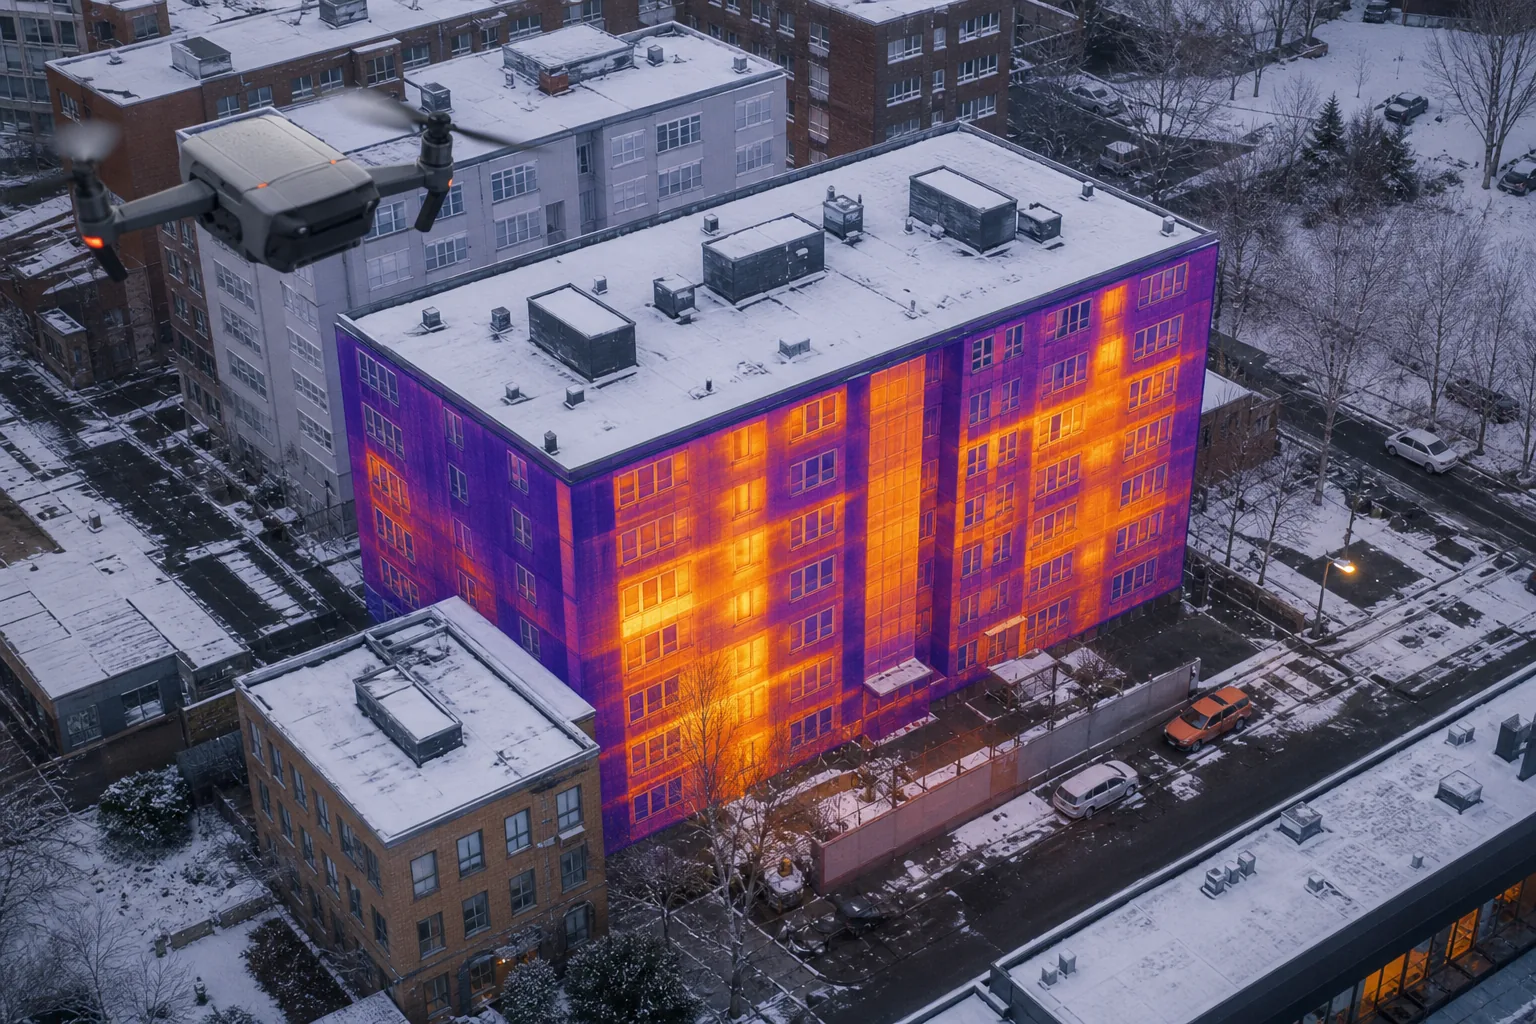
Winter makes heat‑loss spots pop out, so you need solid data fast. Below is a usable, step‑by‑step guide to run building envelope diagnostics in cold weather, from scope definition to a risk‑ranked action plan.
Step 1: Define the Diagnostic Scope and Winter Survey Objectives
First, write down exactly what you need to know. Are you checking roof leaks, wall insulation gaps, or solar‑panel heat‑loss? List the building zones, the performance targets (e.g., U‑value limits), and any regulatory frameworks you must meet, such as PAS 2035 or CIBSE guidance.
Next, set clear objectives for the winter survey. Typical goals include:
- Capture temperature differentials when outdoor temps are below 5 °C.
- Identify thermal bridges that drive energy waste.
- Produce a report that feeds directly into a retrofit funding application.
Write these goals into a brief that you can hand to the inspection team. A concise brief keeps everyone aligned and stops scope creep later.
When you have the brief, check it against any contractual clauses that require independent evidence. Public‑sector clients often need an impartial report that can be audited.
Step 2: Confirm Weather, Building Operation and Survey Safety Conditions
Winter weather can be unpredictable. Use a reliable forecast service and pick a day when the temperature is stable for at least three hours. A temperature swing of more than 2 °C during the survey can blur thermal contrasts.
Make sure the building is operating as it will be in normal use. Turn on heating systems, ventilation, and any solar PV arrays. Running the building at its typical set‑points ensures the thermal image reflects real‑world heat flow.
Safety comes first. Conduct a risk assessment that covers wind speed, icy surfaces, and drone flight restrictions. Ensure any drone survey is planned in accordance with applicable flight and site-safety requirements. Document the safety plan and share it with site managers.
For a quick reference on UK building regulations, see the official guidance. It outlines the minimum standards for insulation and thermal performance.
Step 3: Inspect the External Building Envelope Safely
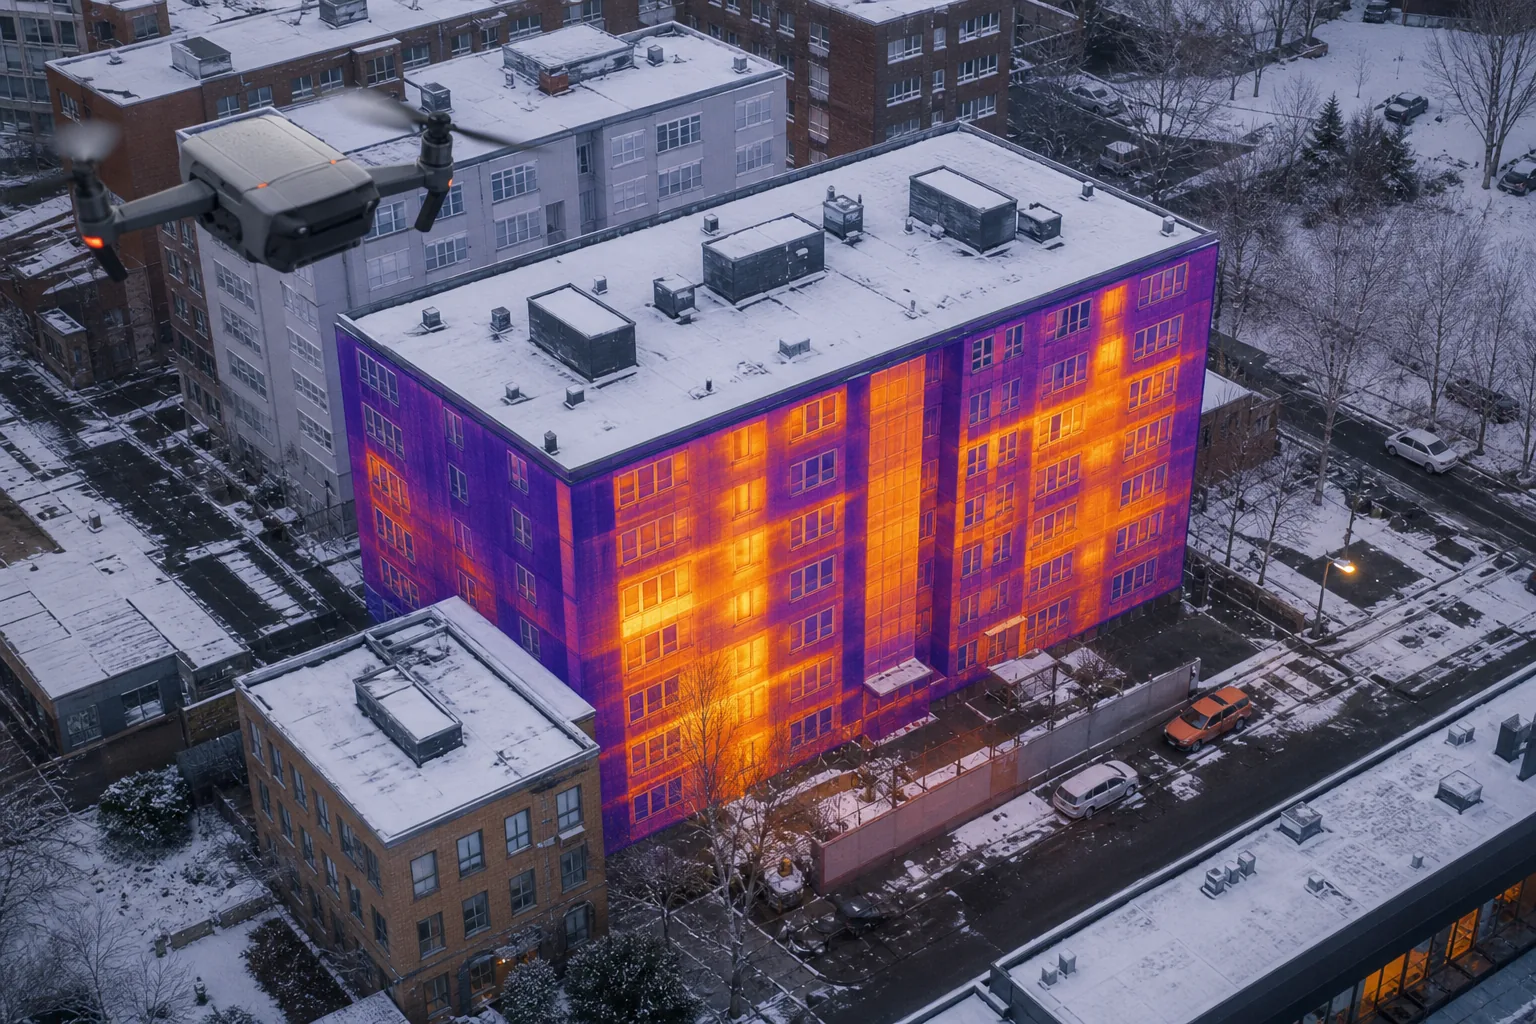
Deploy a CAA‑approved drone equipped with a calibrated thermal camera. Fly at a distance that captures the full façade while staying clear of any obstacles.
Start at the roof level and work downwards. This order prevents wind‑generated drift from disturbing the drone’s stability as you move lower. Capture overlapping images so you can stitch a 3‑D model later.
Pay special attention to known weak points: roof‑wall junctions, parapet walls, skylights, and external cladding seams. These are common sites for cold bridging.
Record the GPS coordinates of any hot or cold spots you see. That data will help you match thermal anomalies to specific building elements when you analyse the images.
Step 4: Capture and Corroborate Thermal and Moisture Evidence
Thermal images alone can be misleading if moisture is present. Pair each thermal shot with a moisture meter reading or a visual inspection for condensation.
Use a handheld infrared thermometer to verify the temperature reading at the camera’s pixel centre. This cross‑check catches any emissivity errors caused by reflective surfaces.
When you spot a cold anomaly, walk the area with a moisture sensor. If the reading is above the 1 % threshold, you likely have a leak or trapped moisture behind the cladding.
Document both the thermal map and the moisture data in a single report file. This combined evidence meets the IEC 62446 requirement for solar‑PV thermography and satisfies most public‑sector audit trails.
Heat moves through walls, roofs, and windows. Background information is available.
Step 5: Interpret Findings, Rank Risks and Produce an Action Plan
Now turn raw data into decisions. Load the thermal images and 3‑D point cloud into a GIS‑style viewer. Overlay the moisture readings and annotate each hotspot with a risk rating: High, Medium, or Low.
High‑risk items are those that show both a temperature delta greater than 5 °C and moisture above 1 %. These usually indicate a breach in the weather‑proofing layer and should be fixed first.
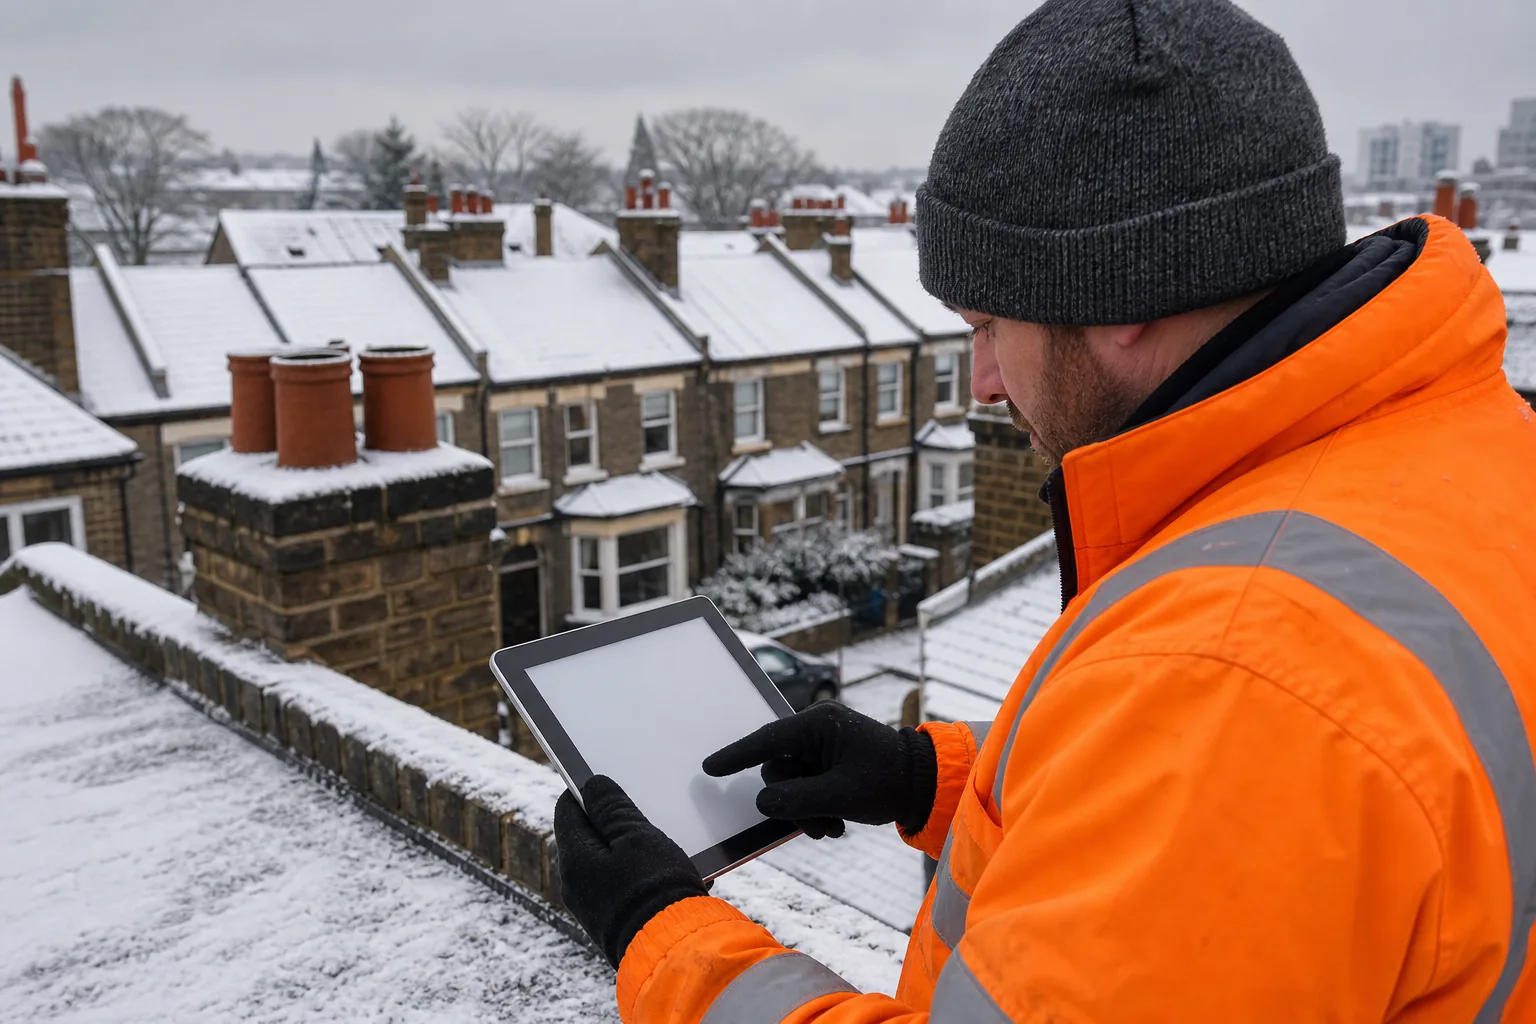
Medium‑risk items have a temperature delta but no moisture, pointing to thermal bridging that can be mitigated with insulation upgrades.
Low‑risk items are isolated cold spots that may be caused by shading or surface finish. They can be monitored rather than repaired immediately.
| Finding | Temp Δ (°C) | Moisture % | Risk | Suggested Action |
|---|---|---|---|---|
| North‑west roof‑wall junction | 7.2 | 1.4 | High | Replace flashing and reseal joints |
| South façade cavity wall | 4.8 | 0.6 | Medium | Inject cavity insulation |
| East‑side solar panel array | 2.1 | 0.2 | Low | Monitor during next season |
Summarise the ranked list in a clear report that includes:
- Executive summary with total heat‑loss estimate.
- Annotated thermal maps and 3‑D model screenshots.
- Risk‑based recommendation table (like the one above).
- Cost‑benefit notes that tie each fix to potential energy savings.
When the report is ready, hand it to the facilities manager or the retrofit consultant. They can feed the data straight into a PSDS Phase 4 funding application.
Visual Perspectives Limited can run the whole workflow for you, delivering the 3‑D CAD model, IEC 62446‑compliant thermography report, and a risk‑ranked action plan in one package. Our winter‑ready drone service means you get the most reliable heat‑loss data when it matters most.
FAQ
Can I do building envelope diagnostics in winter without a drone?
Yes, you can use a handheld thermal camera, but a drone gives you a complete, high‑resolution view of roofs and façades that are hard to reach on foot.
What temperature range is ideal for thermal imaging?
Thermal contrast is strongest when outdoor temperatures are below 5 °C and interior heating is on, because the larger delta highlights heat loss.
Do I need a CAA licence to fly a drone for a survey?
Yes, any commercial drone operation in the UK must follow CAA regulations, which include registration, pilot competency, and line‑of‑sight flight limits.
How does IEC 62446 relate to building envelope work?
IEC 62446 sets the reporting standards for photovoltaic thermal imaging; meeting it ensures your data can be used for both solar‑PV checks and broader envelope diagnostics.
Is a blower‑door test still useful after a thermal survey?
Absolutely; it quantifies air infiltration, which complements the heat‑loss patterns you see in thermal images.
Can the findings be used for PSDS Phase 4 funding?
Yes, the risk‑ranked action plan and quantified heat‑loss numbers satisfy the evidence requirements for PSDS Phase 4 applications.
Running a winter survey gives you the sharpest picture of where energy is escaping, and a clear roadmap to fix it.
Conclusion
Start by defining your scope and then follow the five steps to capture, verify and act on winter‑time thermal data. Contact Visual Perspectives Limited to schedule a compliant, winter‑ready drone survey and get a risk‑ranked action plan you can feed straight into your retrofit funding bid.