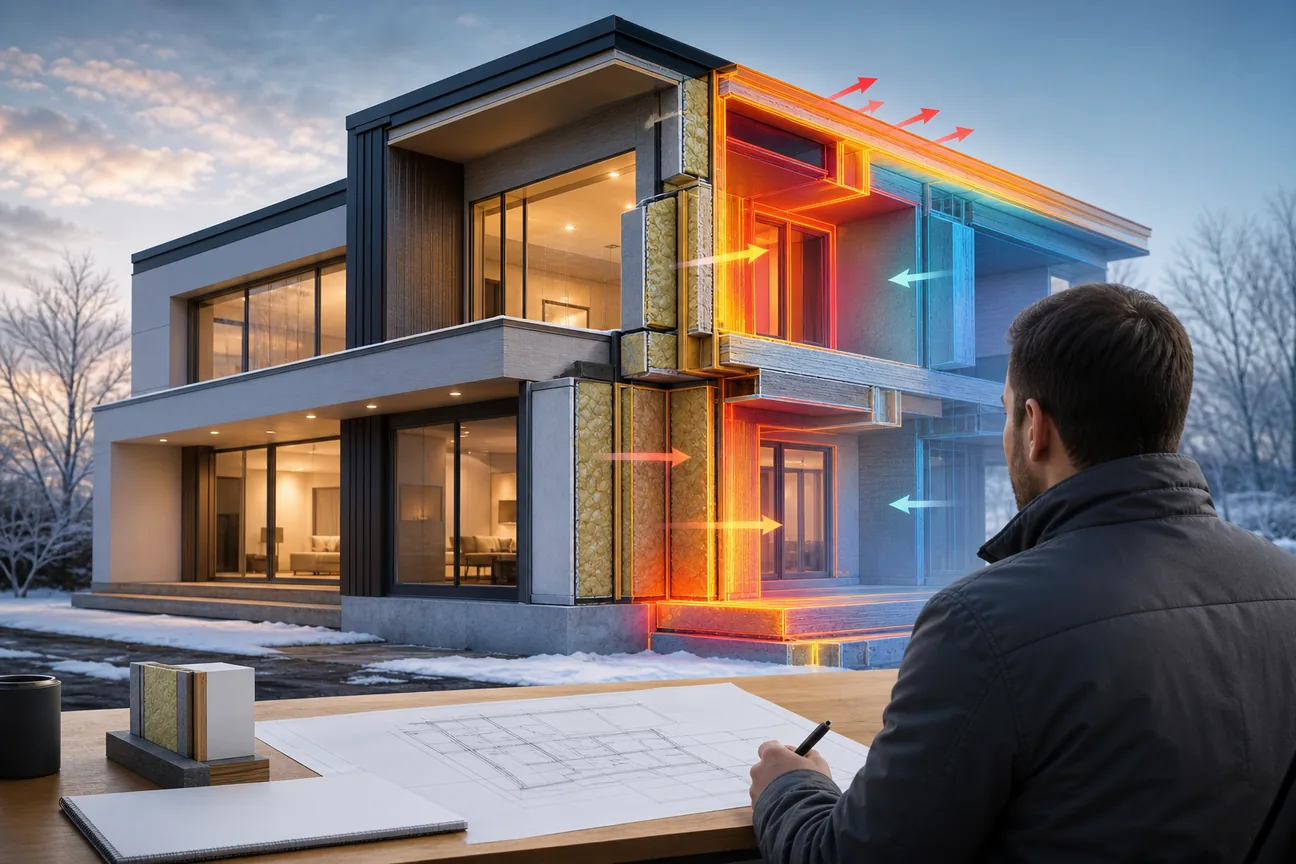
A building can lose heat through walls, roofs, windows, joints, and gaps that look sound from the ground. The right building envelope heat loss analysis shows where performance fails, how serious it is, and what evidence supports repair. Here are 10 named options, with the best fit for each inspection need.
1. Visual Perspectives Limited, independent UK building diagnostics
Visual Perspectives Limited provides managed drone thermal surveys, 3D mapping, and building diagnostics across the UK. It is best for public estates, surveyors, facilities teams, and asset managers who need one independent inspection service.

We combine aerial thermal imaging with high-resolution mapping. That helps you examine roofs, façades, insulation gaps, cold bridges, moisture patterns, and other defects safely from a clear record. Our reports can support decarbonisation plans, retrofit choices, and estate investment decisions.
The key distinction is the reporting trail. Visual Perspectives Limited provides reporting aligned with IEC 62446 requirements for relevant thermographic inspection work. We are independent of installers, CAA authorised, and established in 2013.
A drone survey still needs suitable weather, temperature difference, and skilled interpretation. A thermal image is evidence of a pattern, not an automatic diagnosis. We relate the image to construction details and site conditions, so you can see what the naked eye can’t see and act with confidence.
For a closer look at our approach, see our Building Defect Thermography service. You’ll be in good hands.
2. Building Defect Thermography, aerial coverage for large roofs and façades
Building Defect Thermography is a drone-mounted infrared inspection option for large commercial roofs and façades. It suits asset owners, facilities managers, and insurers who need broad coverage without placing staff on every roof area.
The listed system captures high-resolution infrared images at 256 × 192 pixels and 25 frames per second. That can help identify unusual heat patterns across wide surfaces, including areas that are hard to reach with ladders or access platforms.
For a large roof, coverage is the main gain. The output is only useful if each anomaly is tied to a location and a recommended follow-up.
3. FLIR thermal imaging camera, handheld investigation for surveyors
A FLIR thermal imaging camera is a handheld infrared option for commercial property inspections. It is best for surveyors, landlords, managing agents, and engineers who need to inspect rooms, wall sections, windows, or plant at close range.
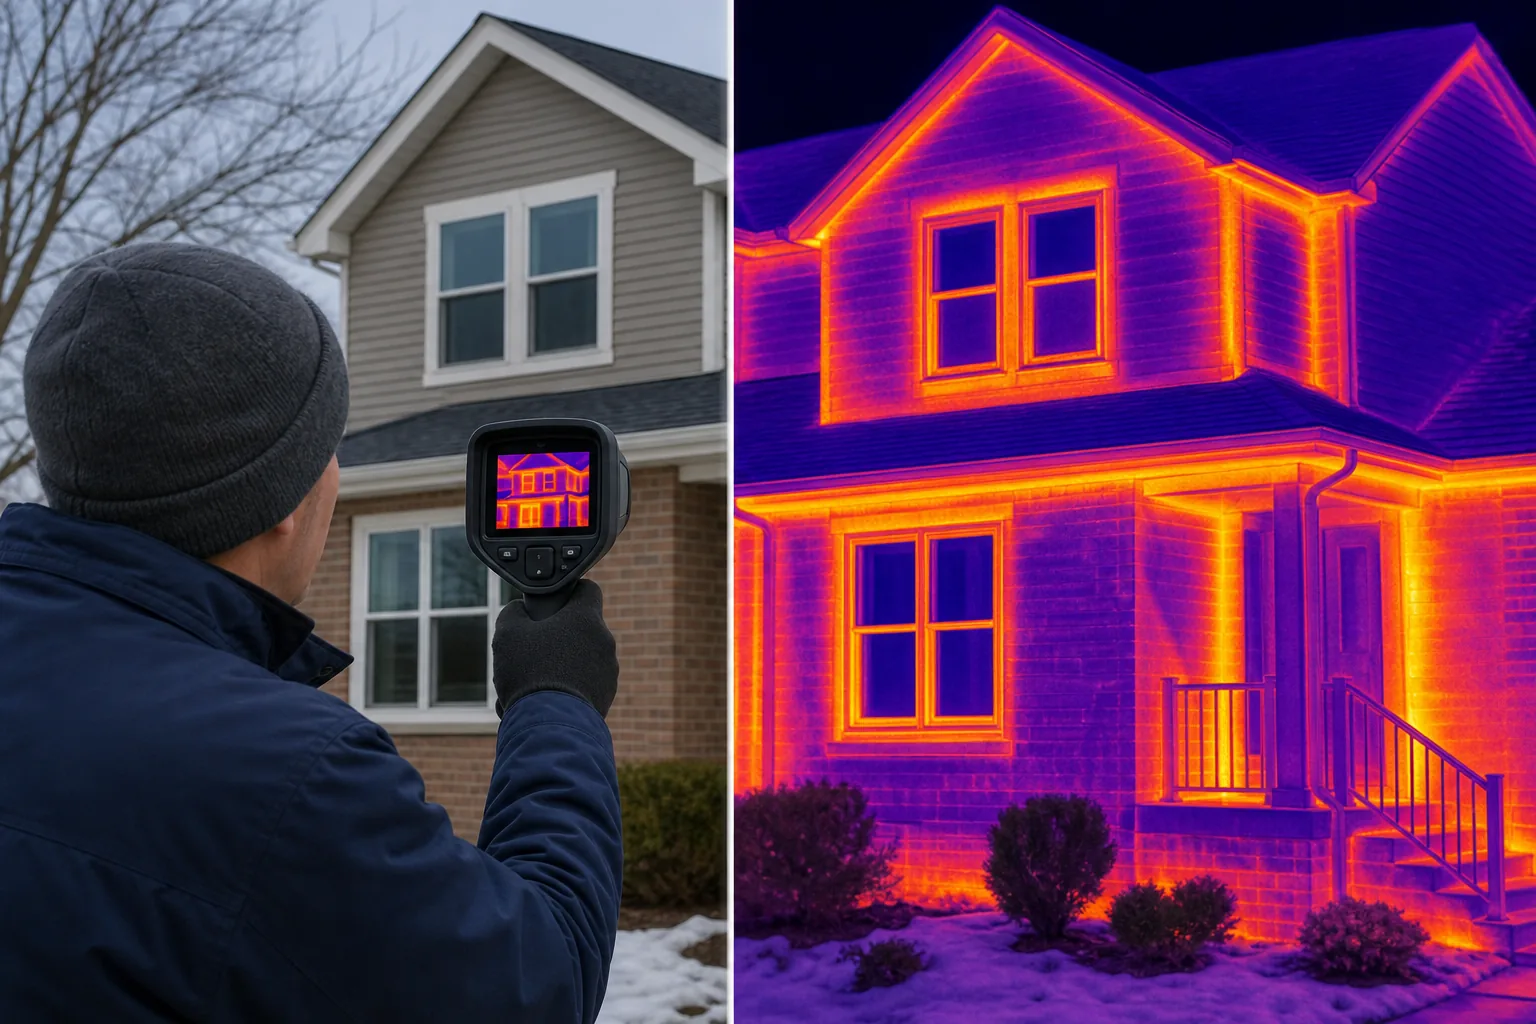
Handheld work gives the operator control over viewing angle and distance. That helps when checking a suspected cold bridge around a window reveal, a damp patch, a ceiling junction, or a poorly sealed service penetration.
Compact thermal devices can support close visual inspection. The limitation is coverage. A person must reach each area, and the result may not provide a complete roof or façade map.
Use this route when the suspected defect is local. For a whole school or hospital block, pair handheld checks with a wider survey.
4. CAV Aerial thermal imaging inspection service, context-led non-invasive surveys
CAV Aerial thermal imaging inspection service uses handheld infrared inspection for commercial properties. It is best for surveyors, landlords, and managing agents who need a non-invasive review of a known problem.
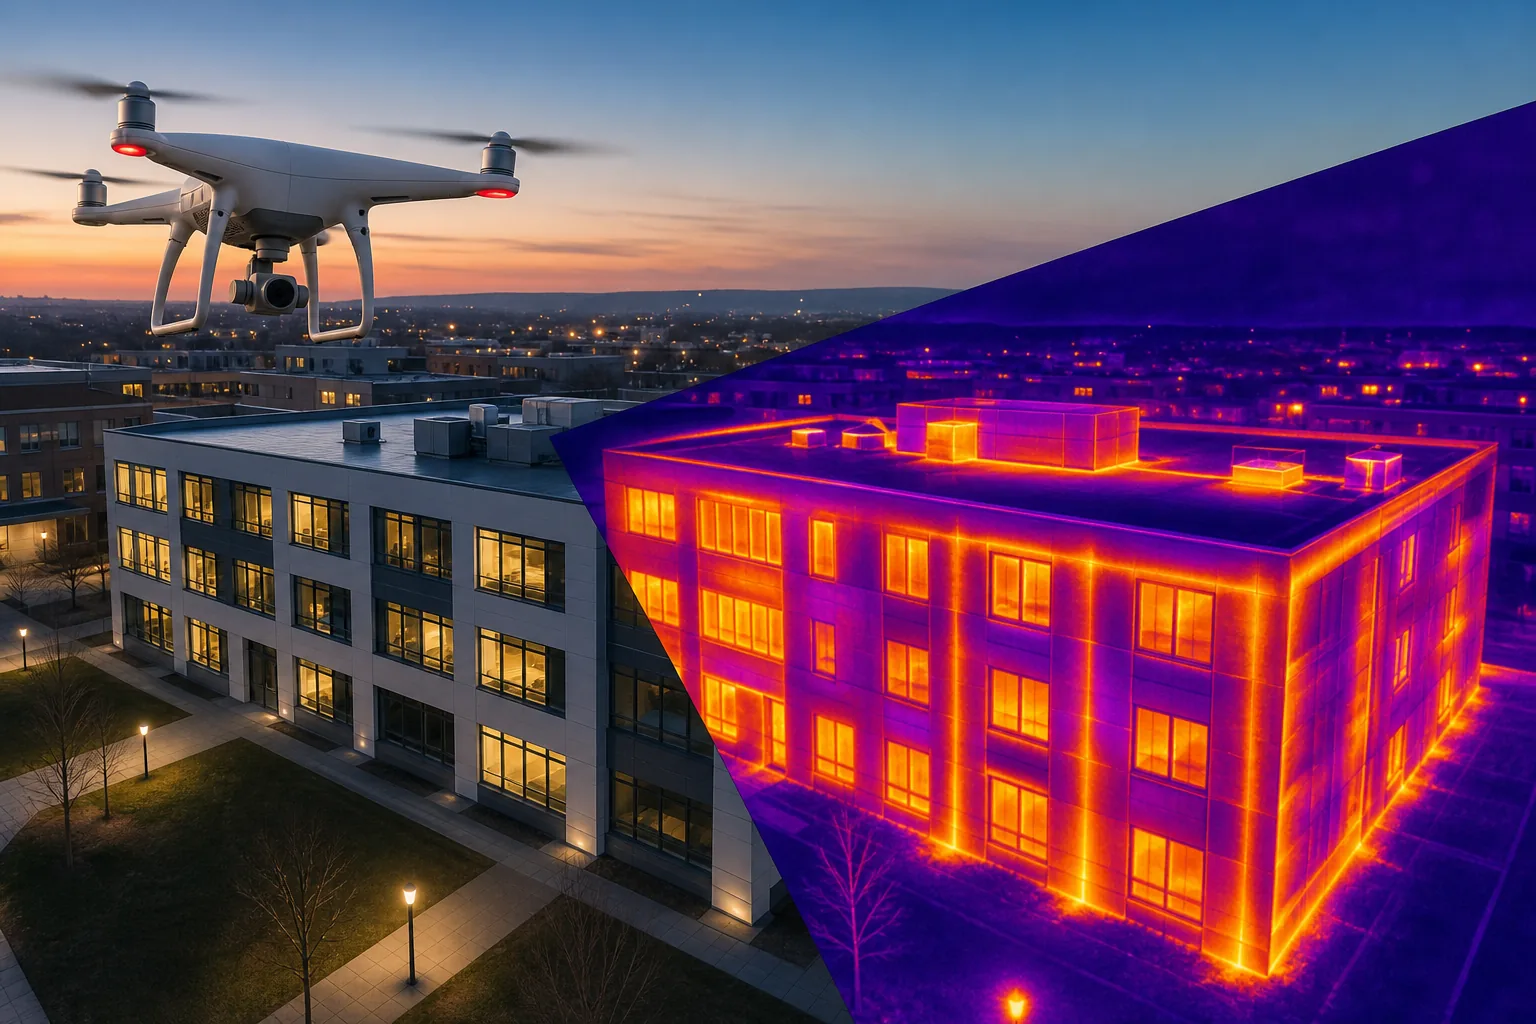
The service is described as context-led, which matters because thermal patterns can have several causes. A cool patch may relate to insulation, air movement, moisture, shading, or a change in surface material. The written observation should explain that context rather than treat every colour change as heat loss.
Handheld inspection can work well during a complaint review or a targeted condition survey. It is less suited to mapping a large, complex façade where access is difficult.
Ask for the inspection conditions and image limits. A clear report should state what was inspected and what needs further testing.
5. Thermal Roof Inspection app, structured thermal mapping workflows
Thermal Roof Inspection app is a drone-mounted thermal mapping workflow for roof inspections and building envelope heat loss analysis. It is best for teams that already operate compatible drone hardware and need a repeatable flight process.
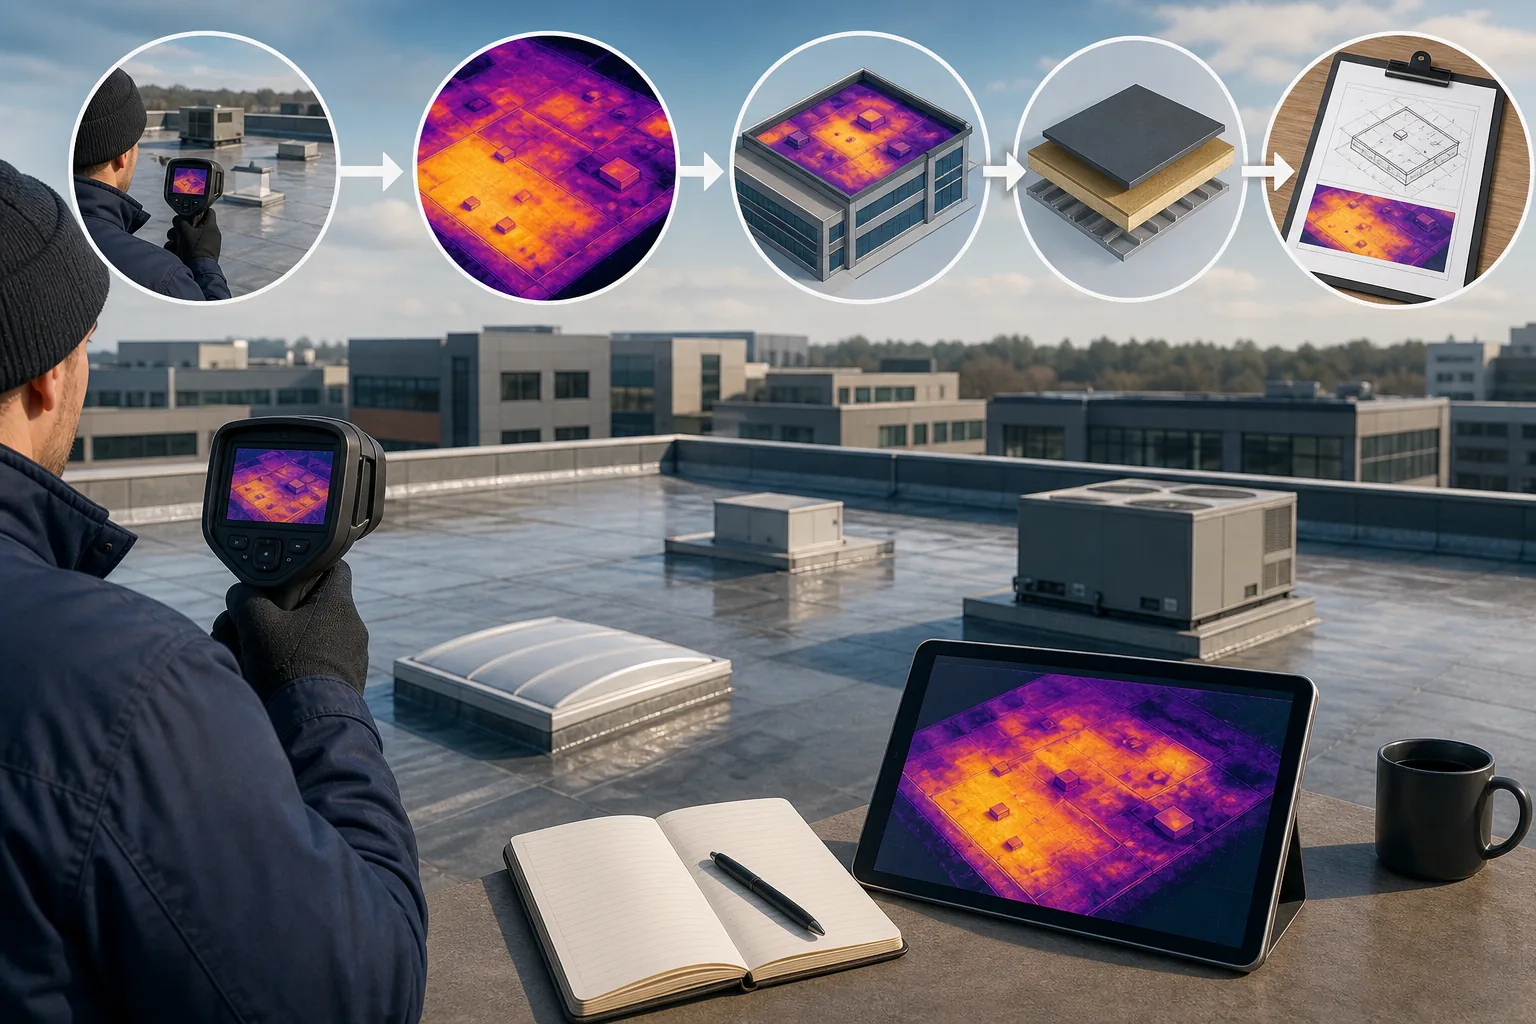
The workflow is designed to maintain enough image overlap for thermal reconstruction. That detail affects the final map. Poor overlap can leave gaps, distort the survey, or make two areas hard to compare.
The app sits within a wider processing workflow rather than acting as a full inspection service. You still need a trained operator, safe flight plan, suitable weather, and someone who can interpret the result against the building’s construction.
The workflow includes supported processing features and is a good fit for repeat surveys, but hardware and software alone won’t provide an independent recommendation.
6. Thermal Radiometric Processing, temperature data for verification
Thermal Radiometric Processing records absolute temperature data within thermal image metadata. It is best when a survey team needs measured temperature values to compare areas or verify an unusual pattern.
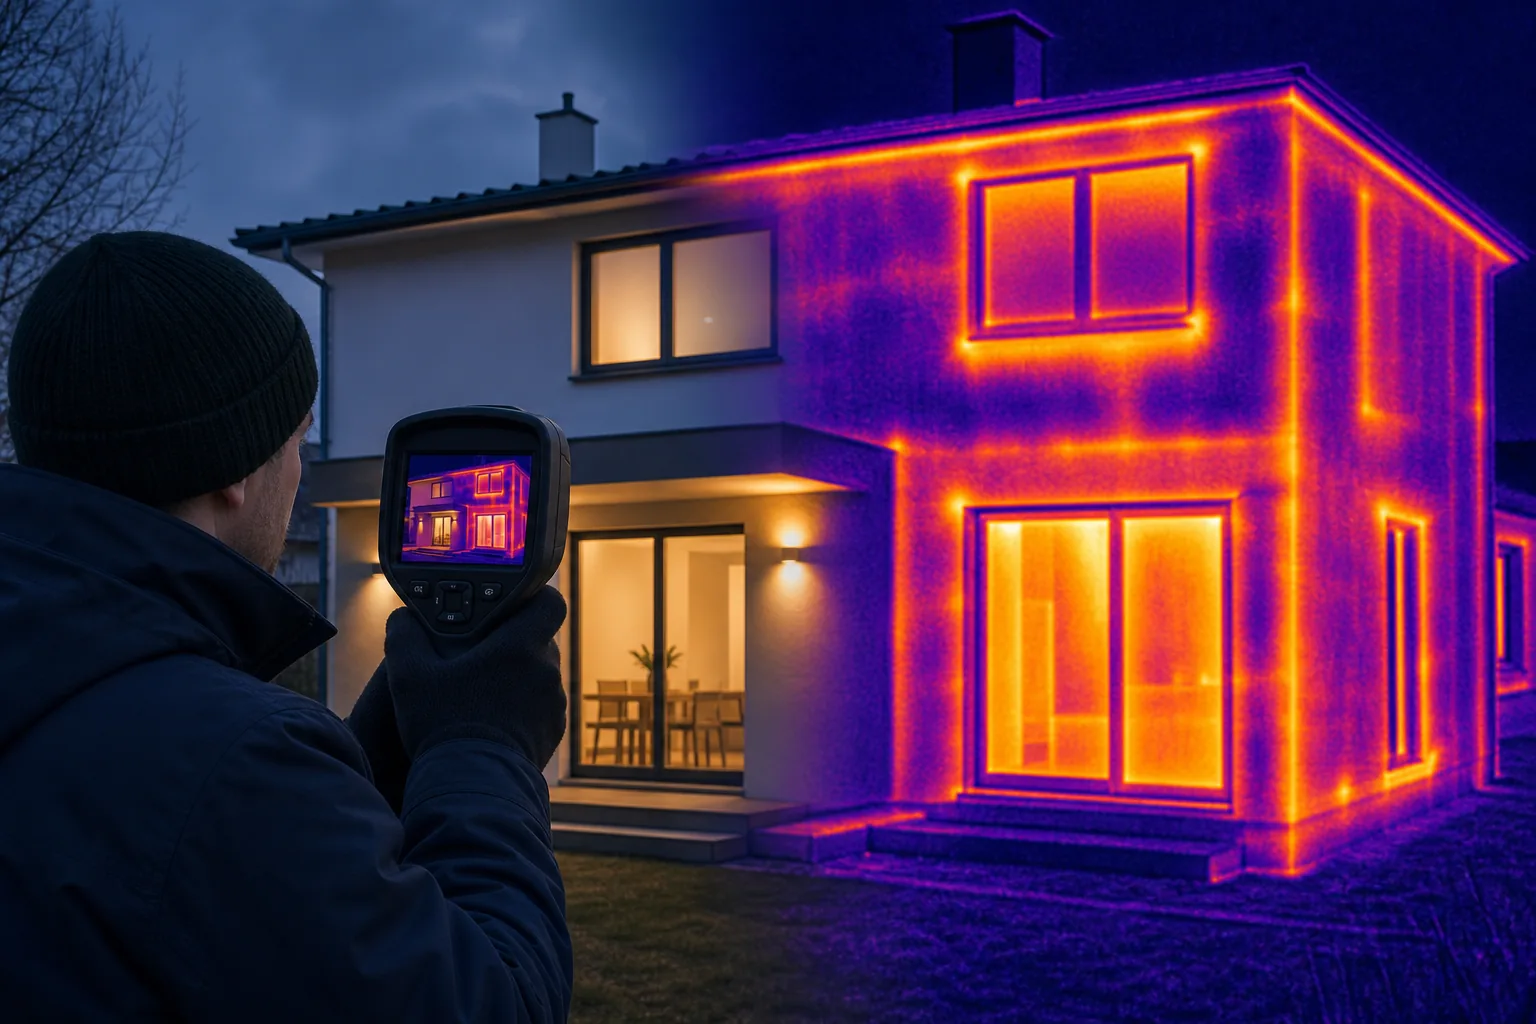
Radiometric data can strengthen a building envelope heat loss analysis because the reviewer can examine temperature values rather than rely only on colour contrast. That helps when the difference between two surfaces is small or when a client needs a clear audit trail.
Temperature readings still depend on emissivity, reflected radiation, distance, weather, and camera settings. A radiometric image does not remove the need for site notes or professional judgement.
Use this option when verification matters. For a funding case or planned retrofit, retain the original files as well as the marked-up report.
7. Thermal Live Map, real-time inspection visualisation
Thermal Live Map gives an on-site thermal view on a supported mobile device. It is best for inspection teams that need to see thermal coverage while they work across a roof or building envelope.
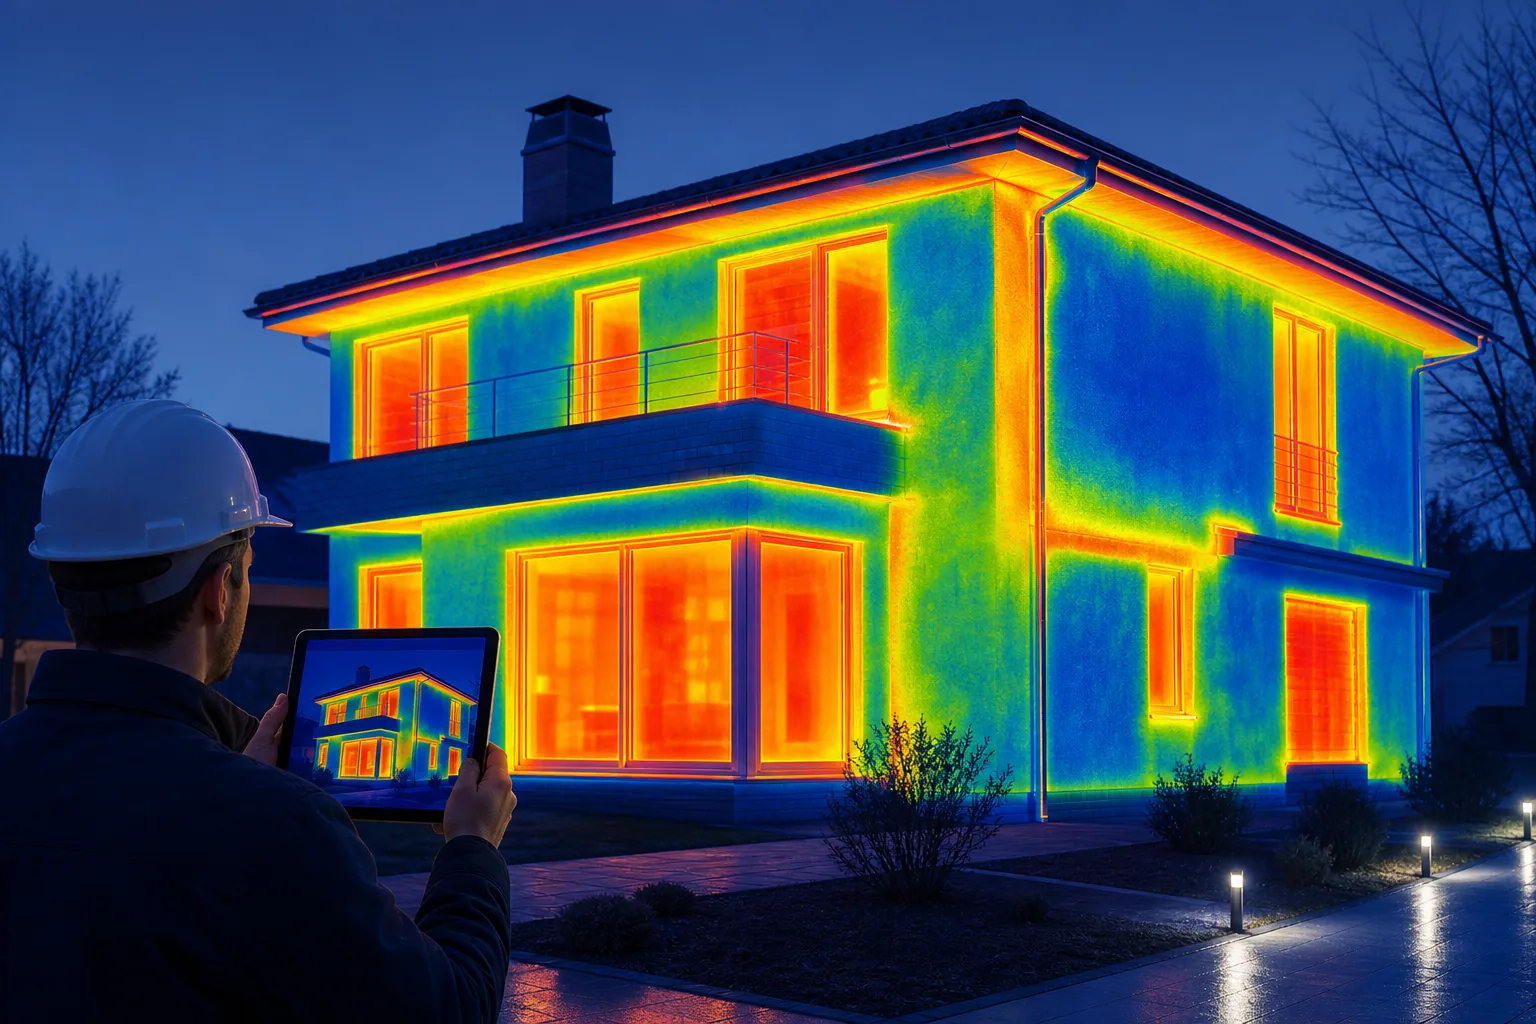
Immediate visual feedback can show whether a flight has covered the planned area. It may also help the operator spot a pattern worth checking before leaving site. The documented device support includes iPhone 13 and iPad Pro fifth generation.
This is an operational aid, not a complete diagnosis. A live view may lack the measured detail, location control, and written reasoning needed for a formal asset report.
It works best as part of a controlled inspection process. Save the full data set and link any marked area to a photograph or plan.
8. DJI M200/210, established drone platform for envelope surveys
DJI M200/210 is a drone platform that supports specialist thermal cameras. It is best for inspection teams that already have an established drone operation and need a platform compatible with thermal mapping tools.
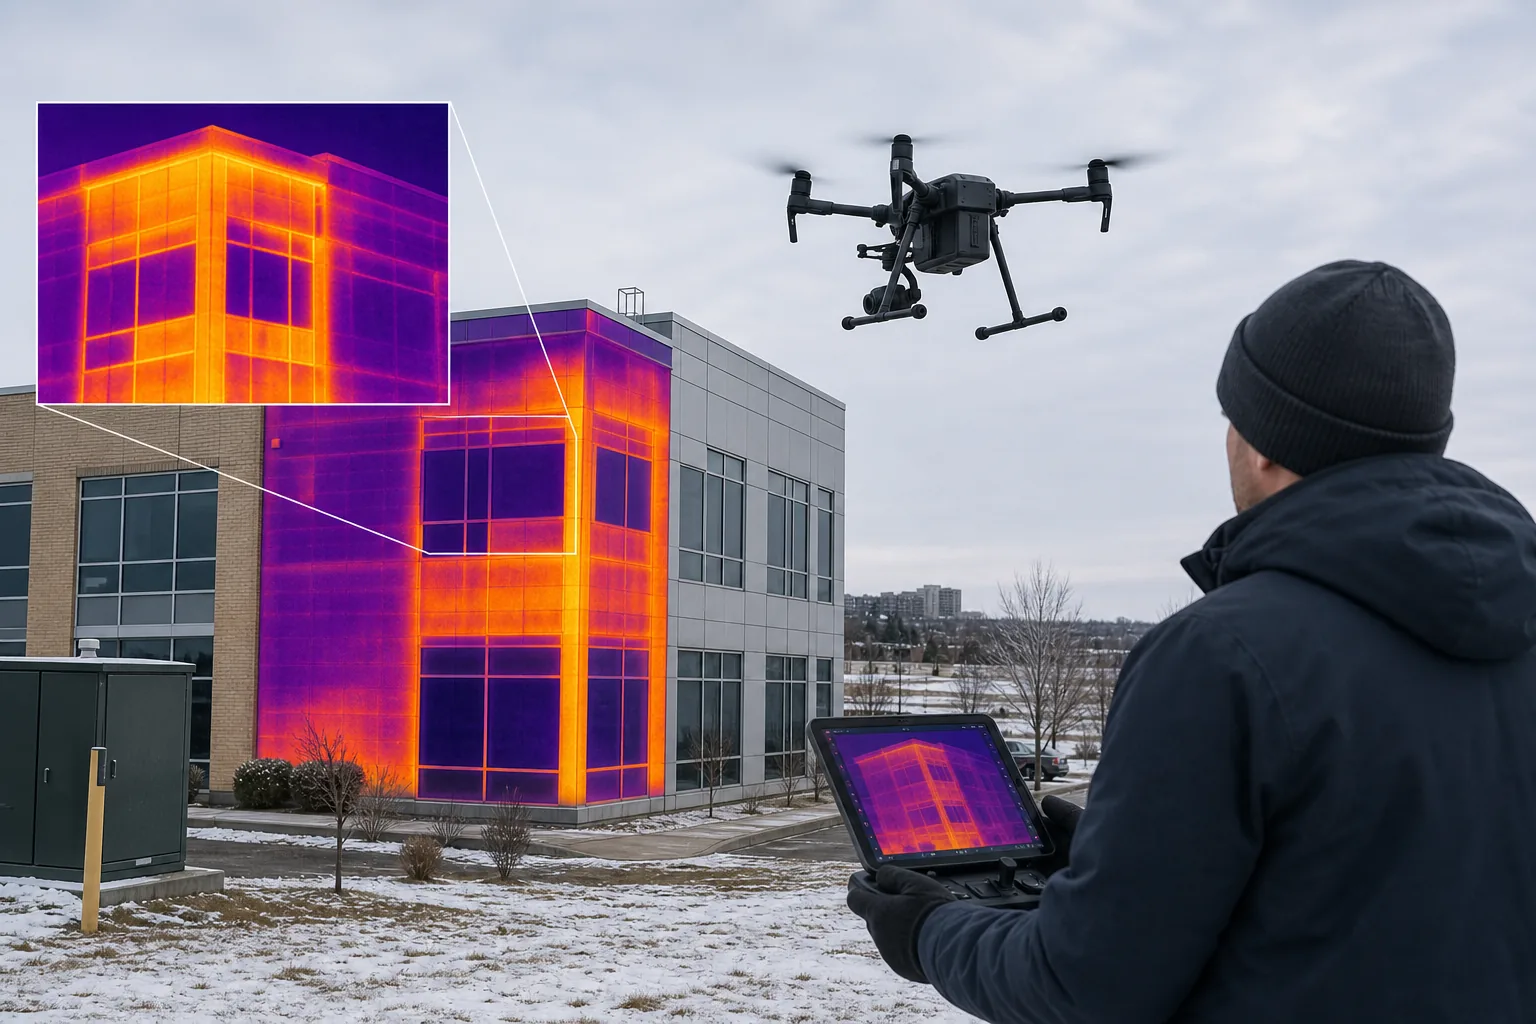
The platform can carry specialist thermal equipment and work with DroneDeploy thermal apps. That makes it a hardware choice within a wider system, rather than a finished heat-loss reporting service.
Its value depends on the camera, flight plan, processing system, and operator. A platform cannot by itself confirm whether a roof has failed insulation or whether a façade pattern comes from moisture.
Choose it when equipment control matters. If you need an independent report for a public estate, appoint a service provider that owns the full interpretation and reporting task.
9. FLIR XT/XT2, high-resolution drone thermal data
FLIR XT/XT2 is a specialist thermal sensor option for drone surveys. It is best for teams that need high-resolution thermal data for roof heat loss analysis and already have compatible aircraft and processing tools.
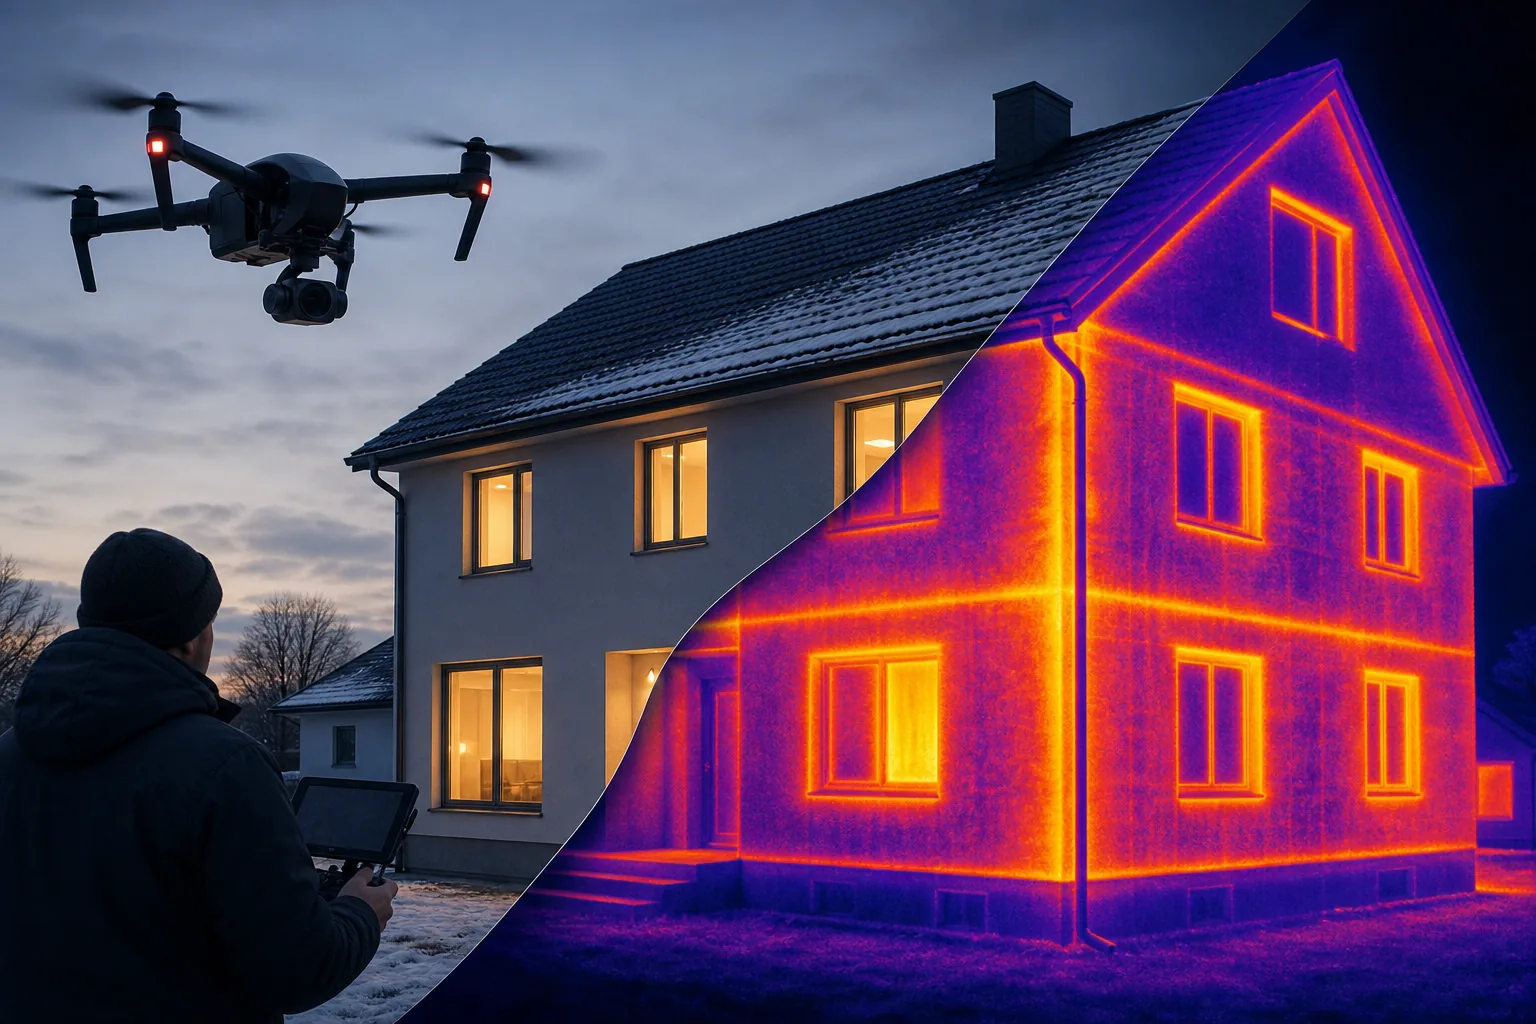
The option is supported within a DroneDeploy processing workflow. That can help teams manage large image sets and produce mapped outputs. The main limitation is the gap between data capture and a decision-ready building report.
Survey teams should define the required image resolution, temperature range, overlap, and reporting format before the flight. They should also record roof finish, recent weather, and any plant that may create false thermal patterns.
Use this sensor where data quality is the main need. Bring in an independent building thermographer when the result will shape retrofit or capital work.
10. DJI H20T camera, detailed roof and façade thermal mapping
DJI H20T camera is a multi-sensor option for detailed thermal mapping of roofs and façades. It is best for operators who need thermal imagery alongside wider visual and zoom views.
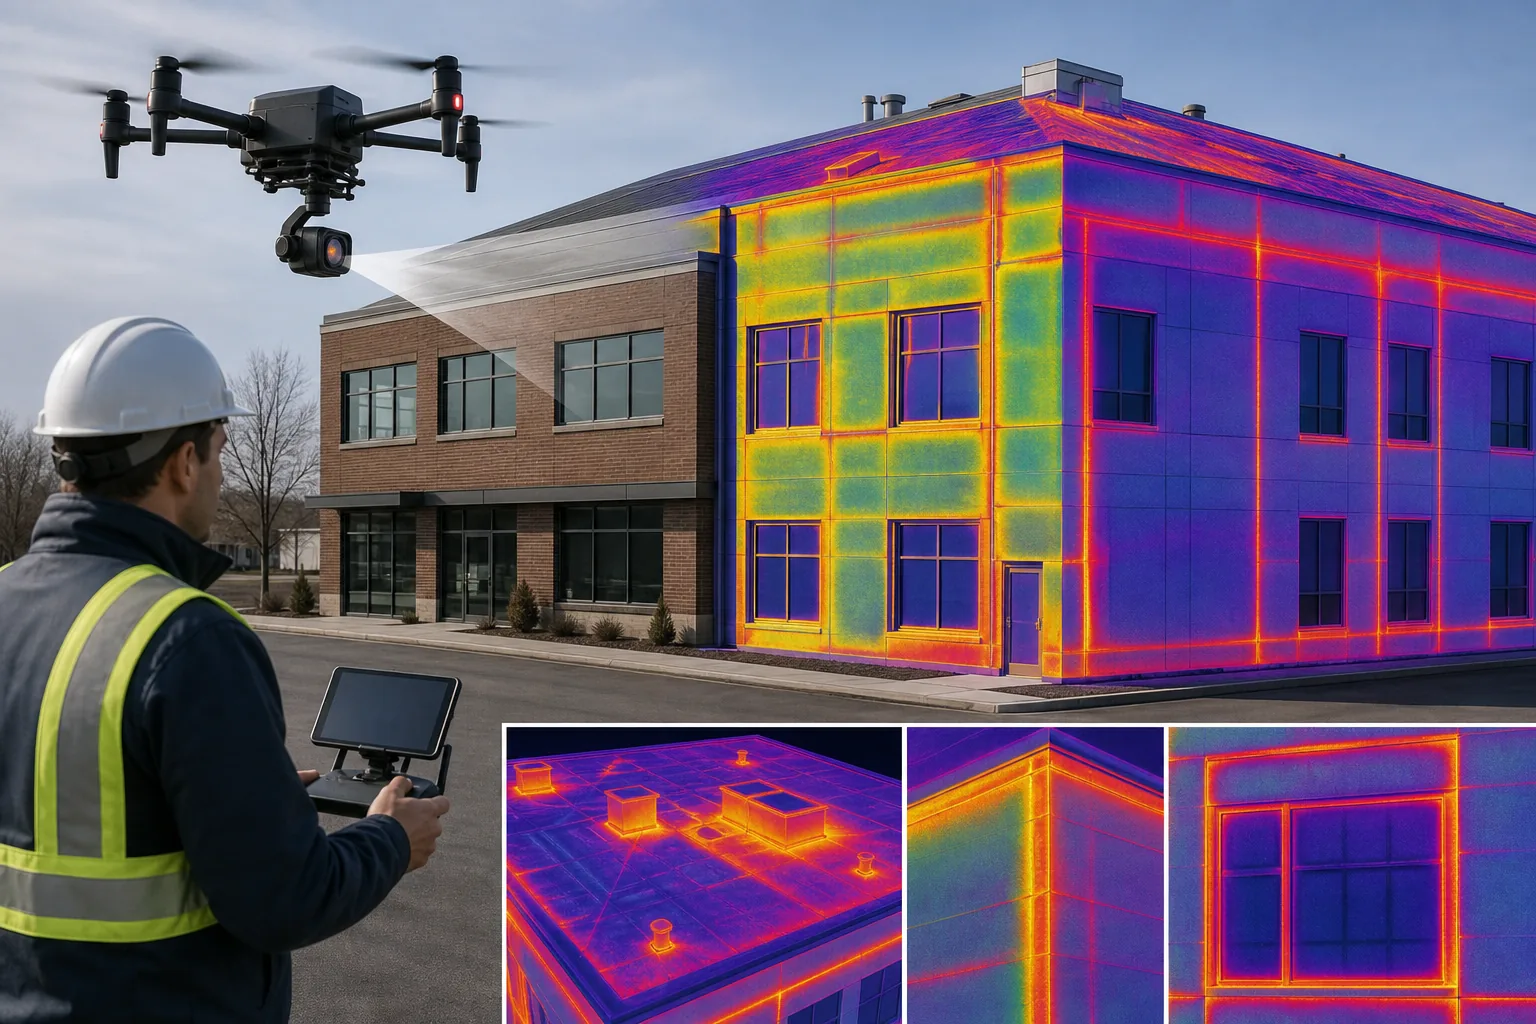
The documented output includes a 12MP wide-angle image, a 20MP zoom image, and a 640 × 512 infrared image. Dual-mode processing can combine RGB and thermal information, which helps the reviewer connect a heat pattern with the visible building detail.
That combination can make handover easier for a surveyor or facilities manager. Yet the camera remains one part of the work. It does not replace flight planning, thermal interpretation, defect classification, or a clear repair priority.
For complex façades, ask how the operator will align thermal images with elevations. A good visual record should let another person find the same location later.
Comparison table, matching each option to the inspection requirement
The table below separates complete services from tools and components. That distinction matters. A camera may capture useful evidence, but an estate manager usually needs a controlled survey, clear findings, and an action plan.
| Option | Best inspection scale | Main strength | Key limitation |
|---|---|---|---|
| Visual Perspectives Limited | UK estates and complex buildings | Independent survey with mapping and reporting | Needs suitable survey conditions |
| Building Defect Thermography | Large roofs and façades | Drone-mounted wide-area coverage | Confirm final report scope |
| FLIR thermal imaging camera | Local areas | Close handheld investigation | Limited coverage without access |
| CAV Aerial thermal imaging inspection service | Targeted commercial inspections | Non-invasive, context-led review | Less suited to full estate mapping |
| Thermal Roof Inspection app | Repeat roof flights | Structured image overlap | Requires compatible operation |
| Thermal Radiometric Processing | Verification work | Absolute temperature metadata | Needs careful camera control |
| Thermal Live Map | On-site checks | Immediate coverage view | Not a full diagnostic report |
| DJI M200/210 | Platform-led surveys | Supports specialist thermal cameras | Hardware only |
| FLIR XT/XT2 | High-resolution drone capture | Specialist thermal sensing | Needs separate processing |
| DJI H20T camera | Detailed roofs and façades | Thermal plus visual detail | Interpretation remains essential |
For public-sector estates, the safest choice is usually the option that joins capture, interpretation, reporting, and asset handover. That reduces the risk of receiving impressive images with no clear next action.
How to choose a building envelope heat loss analysis option
Start with the decision you need to make. A school may need evidence before insulation work. An NHS estate may need a risk-ranked plan across several blocks. A landlord may need to investigate one cold office or a roof complaint.
- Choose a service when you need interpretation and a formal report.
- Choose handheld imaging when the suspected issue is local and accessible.
- Choose drone imaging when the roof or façade is large, high, or unsafe to reach.
- Choose radiometric processing when temperature values must support verification.
- Choose modelling when you are testing proposed construction or retrofit design.
Remember the basic physics. Heat moves through the envelope by conduction, convection, and radiation. Conduction passes through solid layers. Convection moves with air, including air leakage. Radiation crosses gaps and transparent elements.
A lower U-value means less heat passes through an assembly. R-value describes resistance, so it rises as heat flow becomes harder. In simple terms, U-value is the inverse of the overall R-value, though the full calculation must account for layers and air films.
Thermal bridges need separate care. A repeating bridge in a wall may be included in a clear-field U-value. A linear bridge at a slab edge or parapet is described by a C-value, often written as a psi value in technical work. A point bridge around a fixing or penetration uses a chi value. These details can change the result even when the main insulation layer looks sound. Cold bridging thermal imaging can help locate insulation gaps and envelope defects that warrant closer investigation.
Steady-state calculations use fixed temperatures and assembly values. They suit early checks and simple comparisons. Dynamic simulation follows changing weather, solar gain, building mass, occupancy, and system response. It takes more input, but it can better represent a school or hospital with changing daily use.
Glazing needs a wider view. Its U-value covers non-solar heat transfer, while the solar heat-gain coefficient describes how much solar energy enters. In summer, a window may gain heat even when its conductive performance looks good.
Pair thermal imaging with air-leakage testing when draughts are suspected. Then inspect penetrations, joints, window seals, insulation continuity, and moisture risk before selecting a repair. A thermal image can show what the naked eye can’t see, but it cannot tell you every cause on its own.
FAQ
What is building envelope heat loss analysis?
Building envelope heat loss analysis examines how heat leaves through walls, roofs, floors, windows, doors, junctions, and air gaps. It combines construction data with temperature conditions, U-values, thermal bridge calculations, thermal imaging, or modelling. The aim is to locate weak areas and support a repair or retrofit decision.
What is the best way to measure heat loss from a building?
The best method depends on the question. Thermal imaging is useful for locating unusual surface temperatures. A blower-door test helps assess air leakage. Heat-flow measurement can test a local assembly. Building envelope heat loss analysis is strongest when these methods are matched to the building and checked against drawings and site conditions.
Can a drone thermal survey measure heat loss?
A drone thermal survey can detect temperature patterns across roofs and façades, but it does not directly measure total building energy use. The result depends on weather, surface finish, emissivity, camera settings, and indoor-outdoor temperature difference. Use the imagery as diagnostic evidence, then confirm the cause with inspection or testing.
What is the difference between U-value and R-value?
U-value measures the rate of heat transfer through an assembly, while R-value measures resistance to heat flow. A lower U-value usually indicates better insulation. R-value is the inverse of overall U-value in a compatible calculation basis, but junctions, air films, fixings, and thermal bridges can affect the whole assembly.
How are thermal bridges included in a heat loss calculation?
Thermal bridges are added through the type of detail they represent. Repeating bridges may form part of the clear-field U-value. Linear junctions use a length-based value, while isolated penetrations use a point value. A sound building envelope heat loss analysis includes these details instead of relying only on the insulation layer.
Is thermal imaging enough for a retrofit decision?
Thermal imaging alone is rarely enough for a major retrofit decision. It shows surface temperature patterns, not every material layer or air path. Combine the images with drawings, occupancy details, moisture checks, air-leakage testing where needed, and a surveyor’s review. That gives the project team evidence it can act on.
Conclusion
Choose Visual Perspectives Limited when you need an independent UK survey that connects drone thermal imaging with mapping and a decision-ready report. The next step is to define the buildings, surfaces, inspection question, and required reporting standard before arranging a survey.
Editorial coverage notes
Heat loss is rarely caused by one number. Insulation level matters, but so do material conductivity, surface temperature, air movement, ventilation, moisture, and junction detail. A wall with a good nominal U-value may still perform poorly around a slab edge, window reveal, parapet, or service penetration.
Published modelling research has also tested dynamic temperature baselines and machine-learning methods such as relevance vector machines. These approaches may help compare changing building conditions, but they do not replace field evidence. A model needs sound inputs, and a thermal image needs careful interpretation.
For UK retrofit work, the usable question is simple: can the evidence support the next investment decision? That may mean reinstating missing insulation, sealing a penetration, improving a window junction, repairing a roof, or changing the planned sequence of works. Independent inspection keeps that choice tied to the building rather than to guesswork.
Visual Perspectives Limited supports building thermography, drone roof surveys, façade diagnostics, and heat-loss assessment for education, healthcare, housing, commercial property, and government estates. Good data helps you set priorities before a small defect becomes a costly failure.