Solar panel degradation steals power from your roof without you ever seeing it. It shows up as lower output, higher costs, and a shorter warranty life. In this article you’ll meet the best UK inspection services that can spot the hidden loss, keep your asset running, and protect your return on investment.
1. Visual Perspectives – Drone Solar PV Thermography (Our Pick) – High‑resolution, IEC 62446 compliant
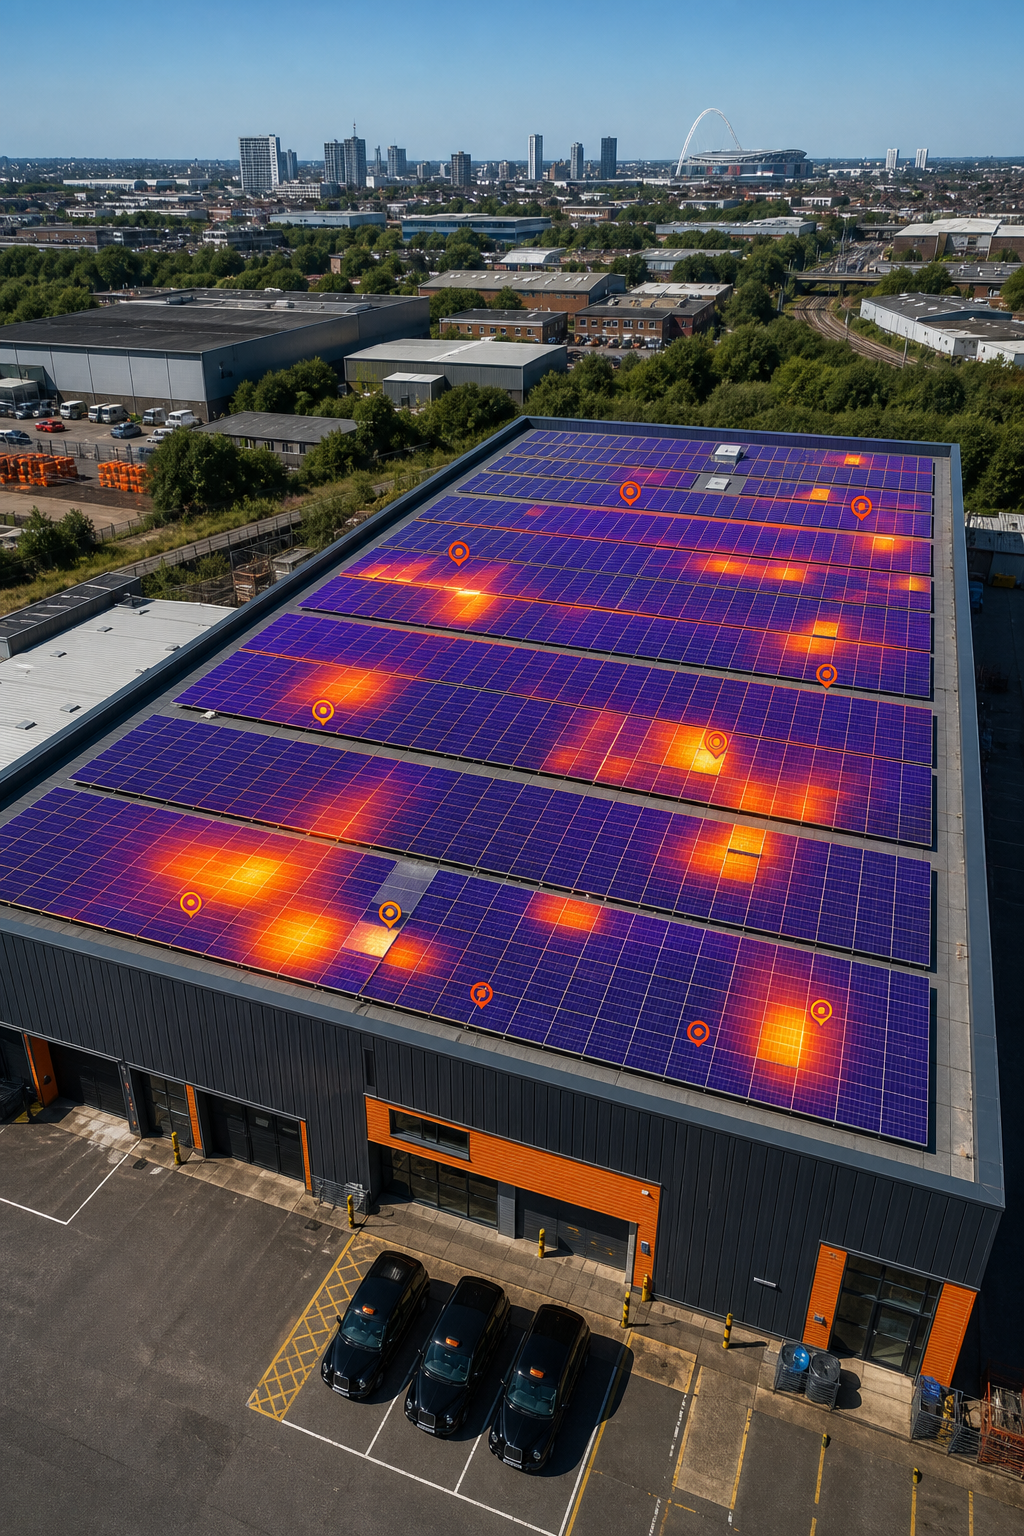
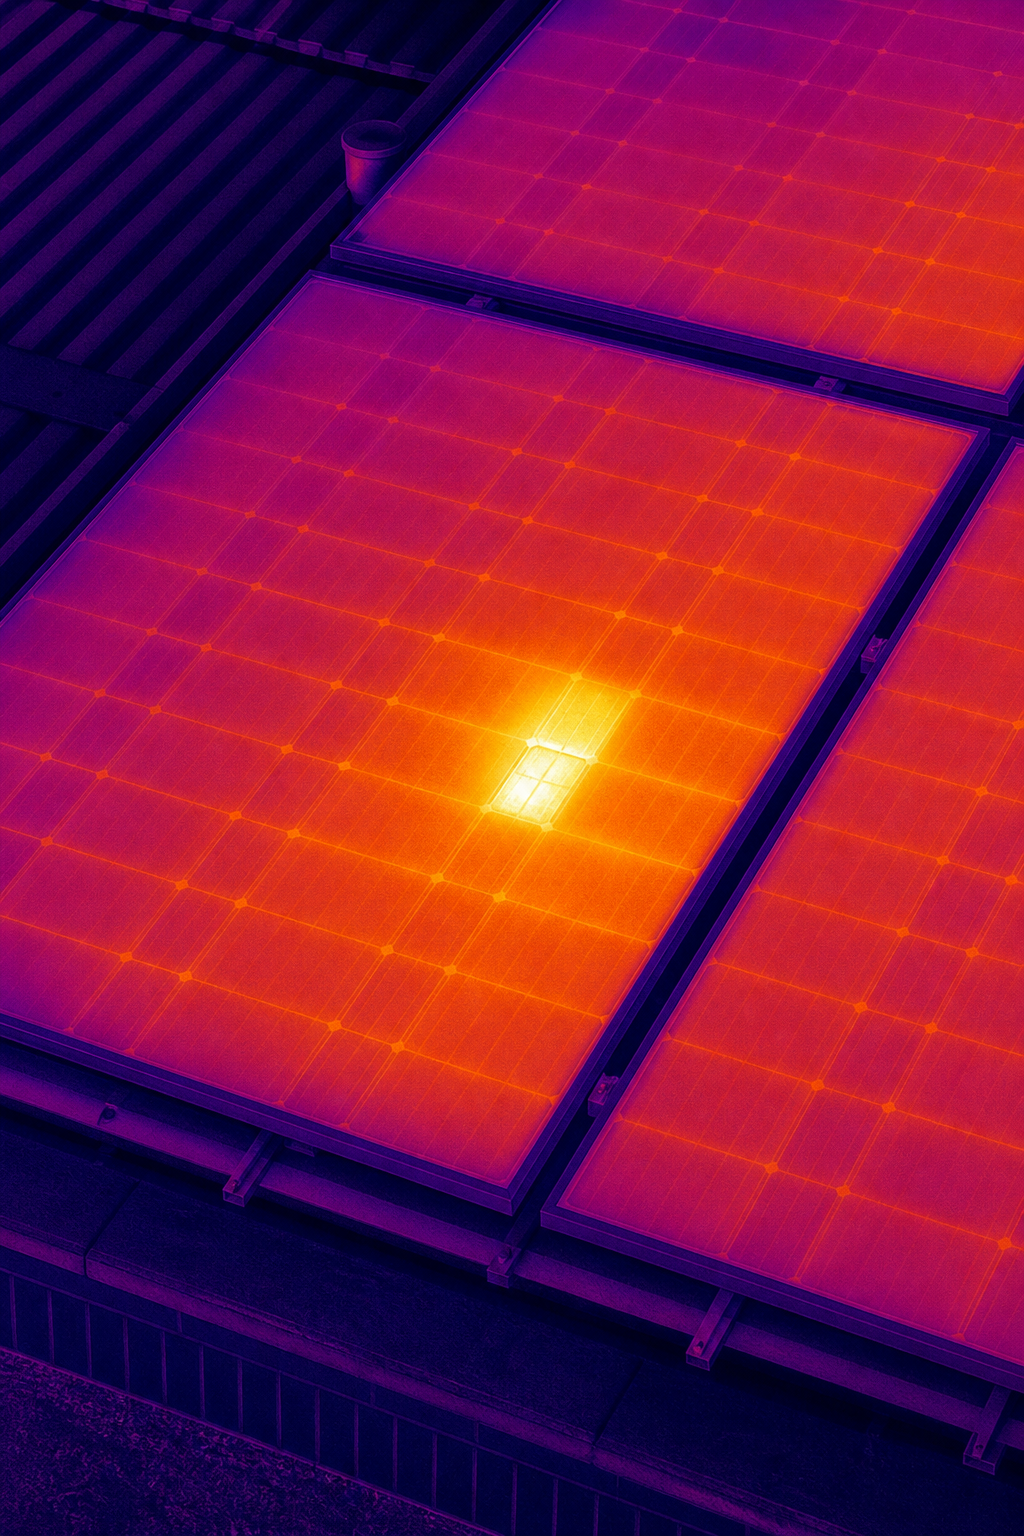
We begin with the service that defines the industry standard. Visual Perspectives operates a CAA‑approved drone fleet equipped with radiometric thermal cameras that satisfy IEC 62446‑3:2017 requirements. The flight plan records every module on a commercial roof in under an hour, and the data is stitched into a georeferenced heat map that reveals temperature differences as small as 0.1 °C. These hot spots indicate cell failures, loose connections, or shading problems that would otherwise remain unseen.
Why is this important? A single hotspot can reduce the output of an entire string by up to 30 %. Early detection enables replacement of the defective module before it compromises adjacent cells. The report also highlights soiling patterns, allowing you to address them and recover a few percent of lost generation each year.
Our team partners with you from start to finish. First we conduct a site risk assessment, then we calibrate the thermal sensor to the day’s irradiance, and finally we deliver an IEC‑compliant report that includes GPS‑tagged defect locations, severity ratings, and a clear action plan. You’ll be in expert hands.
2. Scalable Roof Thermography for PV Assets, Fast, CAA‑approved
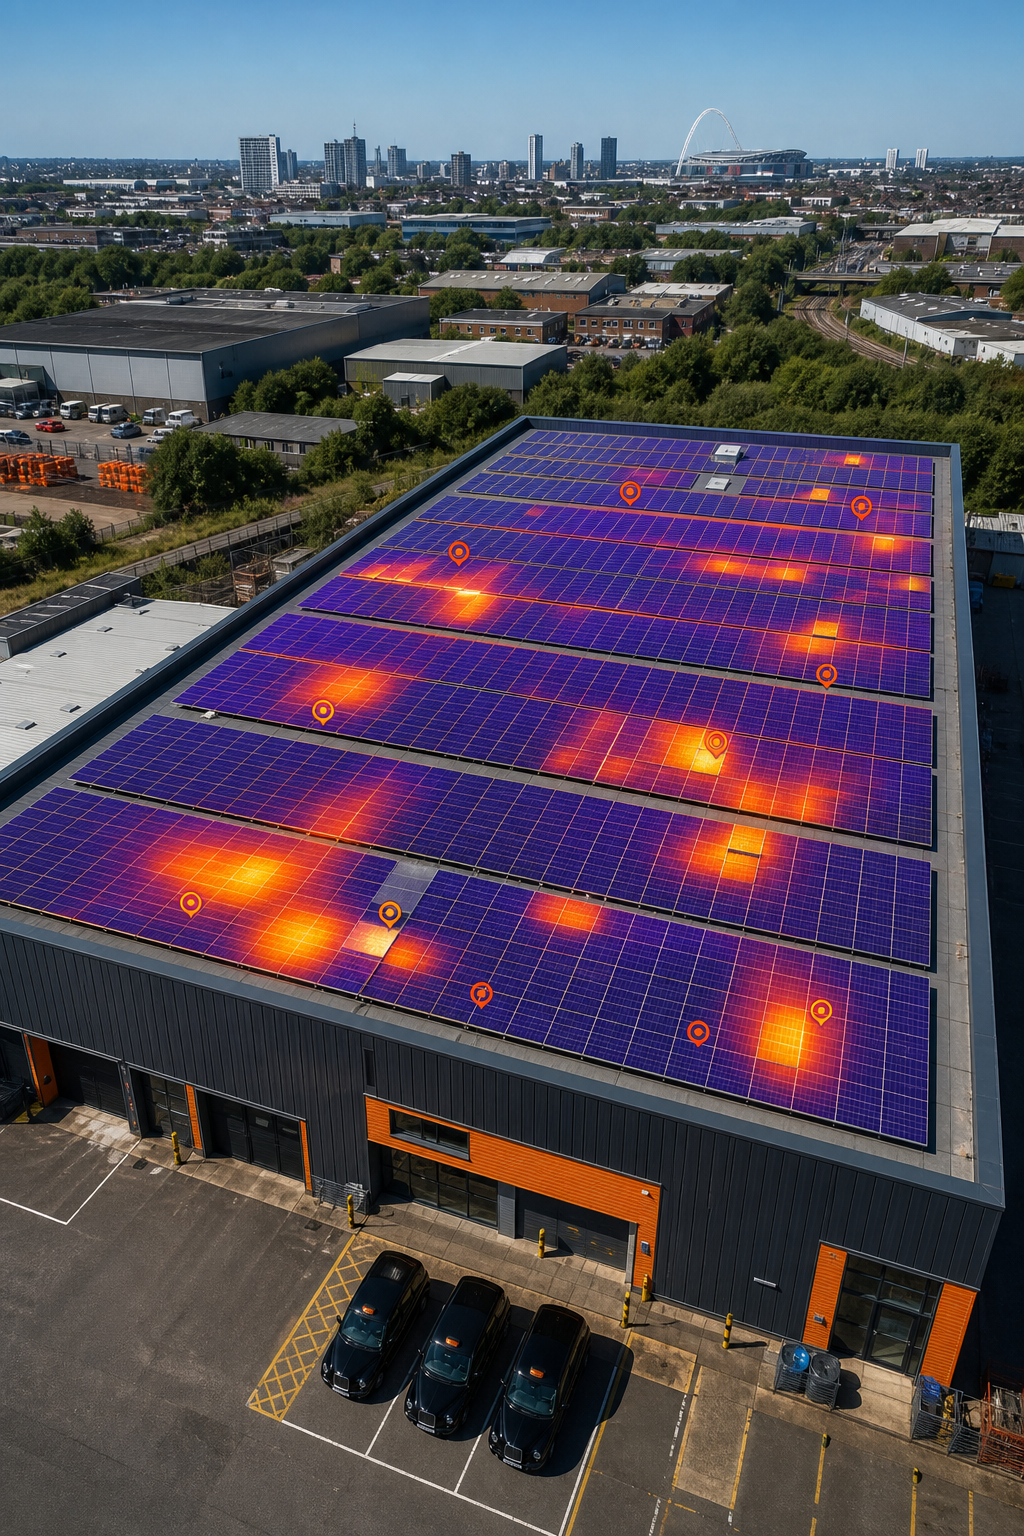
The provider focuses on speed and scale. Their CAA‑approved pilots can cover up to 20 MW of panels in a single day, making them ideal for large commercial campuses or multi‑site portfolios. The service uses a dual‑sensor rig: a radiometric IR camera paired with a high‑resolution RGB cam. The RGB feed helps verify that thermal anomalies are not caused by shadows or debris.
During the flight the system logs wind speed, temperature, and solar irradiance to meet IEC 62446‑3 conditions. After the mission, proprietary software auto‑classifies hotspots, bypass‑diode failures, and PID signatures. The client receives a web‑portal where each defect is clickable, opening a close‑up view and a suggested remediation step.
Because the platform automates much of the analysis, you get a turnaround time of 48 hours instead of weeks. That rapid feedback loop keeps maintenance crews focused on the right panels at the right time.
3. Integrated BIM Mapping + PV Degradation Scan, Integrated BIM data
The service adds a 3‑D model to the inspection workflow. Using Structure‑from‑Motion photogrammetry, the drone builds a point‑cloud of the roof and mounts the PV layout into a BIM environment. Thermal data is then draped over that model, giving a spatial view of performance loss across the whole building.
This approach shines when coordination with architects, facility managers, or insurers is required. The BIM model can be exported to Revit or Navisworks, allowing clash detection between new roof penetrations and existing PV wiring. It also supports asset tagging, with each panel receiving a unique ID that matches the maintenance database.
Clients report that the integrated model reduces design rework by 15 % because engineers can see exactly where shading or heat‑loss occurs before they alter the roof structure.
4. Advanced Multi‑Spectral Drone Imaging, Detect LID & PID early
Visual Perspectives uses a multi‑spectral camera that captures visible, near‑infrared, and short‑wave infrared bands in a single pass. This lets the system spot Light‑Induced Degradation (LID) and Potential‑Induced Degradation (PID) that are invisible to standard thermal IR alone.
The workflow begins with a calibrated flight at solar noon. The software compares the NIR reflectance of each cell to a baseline taken at installation. A drop of more than 5 % flags LID. For PID, the short‑wave infrared band detects subtle heating patterns that indicate voltage‑induced leakage.
By catching LID and PID early, you can replace or re‑wire affected strings before they cause a 20‑50 % power loss. The report also includes a recommendation on PID‑resistant modules for future upgrades.
5. Advanced Thermal Imaging + AI Analytics, Automated Degradation Alerts
Visual Perspectives pairs a high‑resolution thermal camera with a cloud‑based AI engine. After the drone flight, the AI scans each thermogram for anomalies that match known failure signatures, hot spots, cracked cells, diode failures, and even early‑stage PID.
The system learns from each new inspection, improving detection accuracy over time. When a defect exceeds a preset temperature threshold, an automated alert is sent to the asset manager’s dashboard. You can set the alert to trigger a work‑order in your CMMS, closing the loop between detection and repair.
One study showed that AI‑driven alerts reduced the average time to fix a hotspot from 14 days to under 3 days, slashing lost energy by an estimated 2 % per year.
6. High‑Altitude PV Scans – Ideal for large solar farms
Specialist providers offer high‑altitude surveys for utility‑scale farms. Their long‑range drone platform can fly up to 120 m while maintaining a ground sampling distance of 2 cm. This altitude lets the drone cover several hectares in one pass, yet still resolve individual panel defects.
The service integrates data with a GIS platform, mapping each anomaly to a parcel of land. That spatial context is important for large owners who need to prioritize maintenance across dozens of sites.
Because the flight altitude reduces the need for multiple take‑offs, the overall cost per megawatt scanned drops by roughly 30 % compared with low‑altitude providers.
7. Combined Roof & Panel Degradation Reports
The service offers a dual‑inspection package. First a roof‑condition survey looks for moisture ingress, insulation loss, and structural cracks. Then a dedicated PV thermography pass checks each module for hotspots, PID, and soiling.
The combined report aligns roof‑repair recommendations with PV‑maintenance actions, saving owners from scheduling separate visits. For example, fixing a roof leak that was causing moisture‑related PV degradation can be coordinated with a maintenance crew, cutting labor costs.
Clients in the public sector appreciate the single‑source compliance documentation, which satisfies both building regulations and solar warranty auditors.
8. Video‑Walkthroughs with Real‑Time Degradation Metrics
Visual Perspectives delivers a narrated video walk‑through of the entire array. As the drone flies, an overlay shows real‑time temperature graphs for each panel. This visual format helps non‑technical stakeholders, like finance officers, see exactly where loss is happening.
The platform also exports a CSV of temperature deltas, which can be fed into performance‑ratio models. The data reveals a clear correlation: panels with a temperature rise above 25 °C compared to baseline lose on average 4 % of output.
Because the video can be shared with insurers, it speeds up claim processing for damage‑related losses.
9. Certified IEC 62446 Thermography for Public Buildings
The provider focuses on public‑sector contracts such as schools, hospitals, and council buildings. Its inspectors hold Level 1 and Level 2 ITC thermography certifications, ensuring the work meets strict government standards.
The service includes a full IEC 62446‑3:2017 compliant thermal survey, a written risk matrix, and a mitigation plan that aligns with public‑sector procurement guidelines. The report is accepted by most UK insurance underwriters without additional verification.
One municipality saved £45 000 over five years by catching early PID and scheduling targeted cleaning based on the provider’s findings.
10. Advanced Drone Roof Surveys + Degradation Trend Modelling
The service pairs each thermal scan with a historical trend model. By comparing current temperature maps with scans from the past three years, the system predicts which panels are likely to fail next season.
The predictive model uses a regression algorithm that weighs factors such as hotspot intensity, panel age, and local weather data. The output is a ranked list of panels with an estimated remaining useful life in years.
Facilities managers use this list to plan staggered replacements, spreading capital expenditure over several budgeting cycles.
11. Specialist Provider, UV‑Sensitive Imaging for Early Module Cracking
The specialist deploys a UV‑sensitive camera that reveals micro‑cracks invisible to IR or RGB. When UV light hits a cracked cell, it fluoresces, creating a bright line on the image. This method catches structural damage before it turns into a hotspot.
The inspection is performed at dusk, when ambient light is low and the UV illumination is most effective. Results are overlaid onto the thermal map, giving a complete view of both mechanical and electrical health.
Early detection of micro‑cracks can extend module life by up to 5 years, according to field trials.
Buyer’s Checklist , Choosing the Right Inspection Service
FAQ
What is solar panel degradation and why should I worry about it?
Solar panel degradation is the gradual loss of a module’s ability to convert sunlight into electricity. Over time, factors like heat‑cycling, UV exposure, and moisture cause cells to crack, connections to loosen, or the encapsulant to delaminate. The result is lower energy output, higher operating costs, and a shorter warranty life. Detecting degradation early lets you fix the issue before it compounds, preserving performance and ROI.
How often should a commercial PV array be inspected?
Industry best practice recommends an annual thermal inspection for the first three years, then a biennial schedule thereafter. Sites in harsh climates or with high dust loads may need semi‑annual checks. The frequency also depends on warranty terms , many manufacturers require a yearly inspection to keep the warranty valid.
Can drone thermography detect all types of degradation?
No. Thermal imaging catches about 10 % of known degradation mechanisms, such as hotspots, soiling, and some micro‑cracks. Hidden losses like PID or Light‑Induced Degradation often need electrical testing or multi‑spectral imaging. A combined approach that includes both thermal and electrical diagnostics offers the most complete picture.
What does IEC 62446 compliance mean for my inspection report?
IEC 62446 defines the procedures, equipment, and reporting standards for PV system testing. A compliant report includes calibrated temperature data, defined irradiance conditions, and a severity classification that aligns with international best practice. This makes the report acceptable to insurers, regulators, and warranty providers.
How does AI improve the inspection process?
AI algorithms scan thousands of thermograms in minutes, flagging anomalies that match known defect signatures. The system learns from each new dataset, reducing false positives over time. Automated alerts can be sent directly to a maintenance manager’s dashboard, cutting the response window from weeks to days.
What are the cost benefits of regular inspections?
Early detection prevents small issues from becoming expensive failures. For example, fixing a hotspot before it spreads can save up to £5 000 in module replacement costs on a 500 kW system. Moreover, keeping panels operating near their original efficiency can improve annual revenue by 1‑3 %, which adds up over a 25‑year lifespan.
Are these inspections disruptive to building operations?
Drone inspections are non‑contact and can be performed while the system is live. Flights are typically completed in under an hour for a typical commercial roof, with no need for scaffolding or lane closures. The result is minimal downtime and reduced safety risk for staff.
How do I interpret the severity ratings in an inspection report?
Most providers use a five‑tier system: Low, Moderate, High, Critical, and Safety. Low issues might be mild soiling; Moderate could be a hotspot under 30 °C; High often indicates a cracked cell; Critical flags bypass‑diode failure; Safety points to a condition that could cause fire. Prioritize repairs based on the rating and the panel’s contribution to overall output.
Ready to protect your solar investment? Explore our detailed guide on how to plan a commercial solar panel inspection and keep your assets performing at peak efficiency. Commercial Solar Panel Survey: What You Need to Know
Need a full‑service partner that can handle everything from drone flight to BIM integration? Learn how our suite of services can simplify your asset‑management workflow. 6 Essential Drone Survey Company Services for Commercial …
Looking for usable tips on setting up your own roof‑level inspection program? Our step‑by‑step guide walks you through the process, from risk assessment to report review. Drone Roof Survey: A Guide for Commercial Properties
- Confirm CAA authorization and IEC 62446 compliance.
- Check if the provider offers AI‑driven analytics for faster remediation.
- Ask for a BIM‑compatible output if you need integration with building models.
- Verify insurance coverage of the drone operator (minimum £5 million).
- Look for a clear, risk‑rated report that aligns with your asset‑management system.