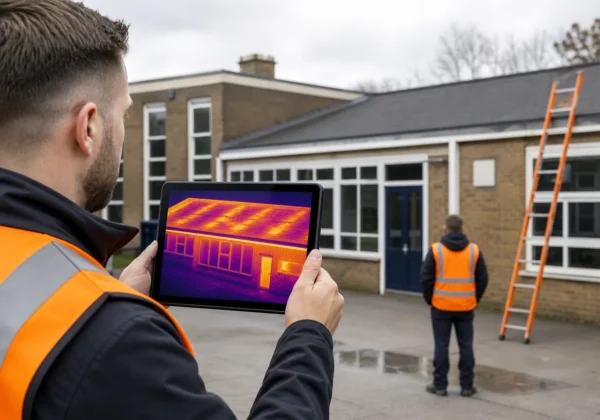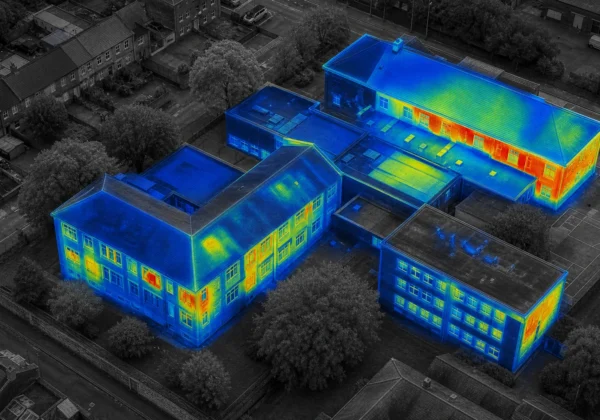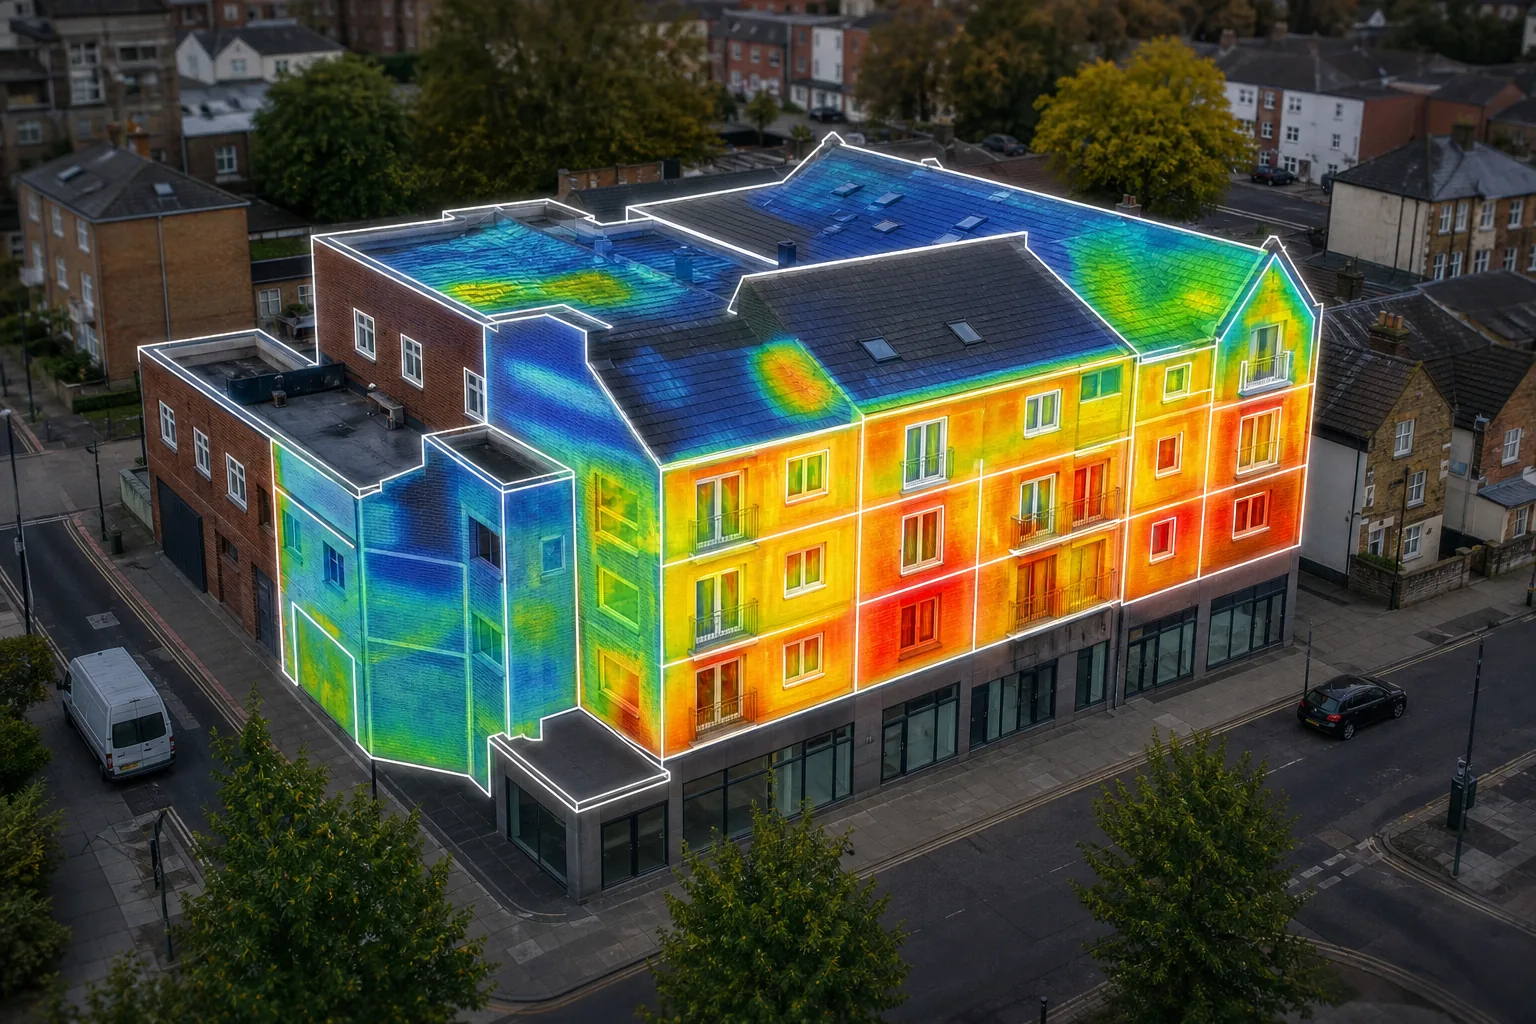
Heat slipping out of a building can cost thousands each year. With a solid heat‑loss diagnostic you can pinpoint the problem spots and plan the right retrofit. Below is a usable, step‑by‑step guide you can follow on any commercial or public‑sector estate.
Step 1: Define the Building Envelope and Survey Objectives
The first task is to spell out exactly what parts of the envelope you will inspect, walls, roof, windows, service penetrations, and why. Are you chasing missing insulation, thermal bridges, or hidden moisture? Write a brief brief that lists each objective and ties it to a policy driver such as PSDS Phase 4 or net‑zero targets.
Visual Perspectives Limited runs a full‑scale definition workshop with your asset team. We map the envelope, tag every surface, and set measurable goals (e.g., reduce U‑value by 0.2 W/m²·K). This ensures every drone flight and thermographic pass is purpose‑driven.
When you know the scope, you can size the data capture, pick the right sensors and decide how deep the analysis must go. A clear brief also helps you meet standards like EN ISO 6781‑1 for building‑fabric thermography.
By now you should have a written envelope map and a set of survey objectives that match your decarbonisation roadmap.
Step 2: Plan the Inspection Conditions and Select the Right Methods
Thermal contrasts are strongest when the building is cooling or heating. Schedule flights for early morning or late evening when interior HVAC is running but outdoor temperatures are stable.
Pick the method that fits each objective. For missing wall insulation, thermal imaging can identify areas of heat loss. For moisture behind flat-roof membranes, a non-intrusive thermal imaging survey can help identify anomalies that a simple visual inspection might miss.
We also check weather forecasts for wind speed (< 5 m/s) and cloud cover (clear skies). Rain or fog scatters IR radiation and blurs the image.
Once conditions are locked, we file a risk assessment, obtain any site permits and upload the flight plan to the flight-planning system. By this point you have a safe, standards-compliant inspection plan.
Step 3: Capture Thermal, Visual and Access Data Safely
On the day of the survey, we launch a CAA‑authorised drone from a safe ground spot. The drone flies a pre‑programmed grid, collecting overlapping thermal and visual frames at 1‑metre resolution.
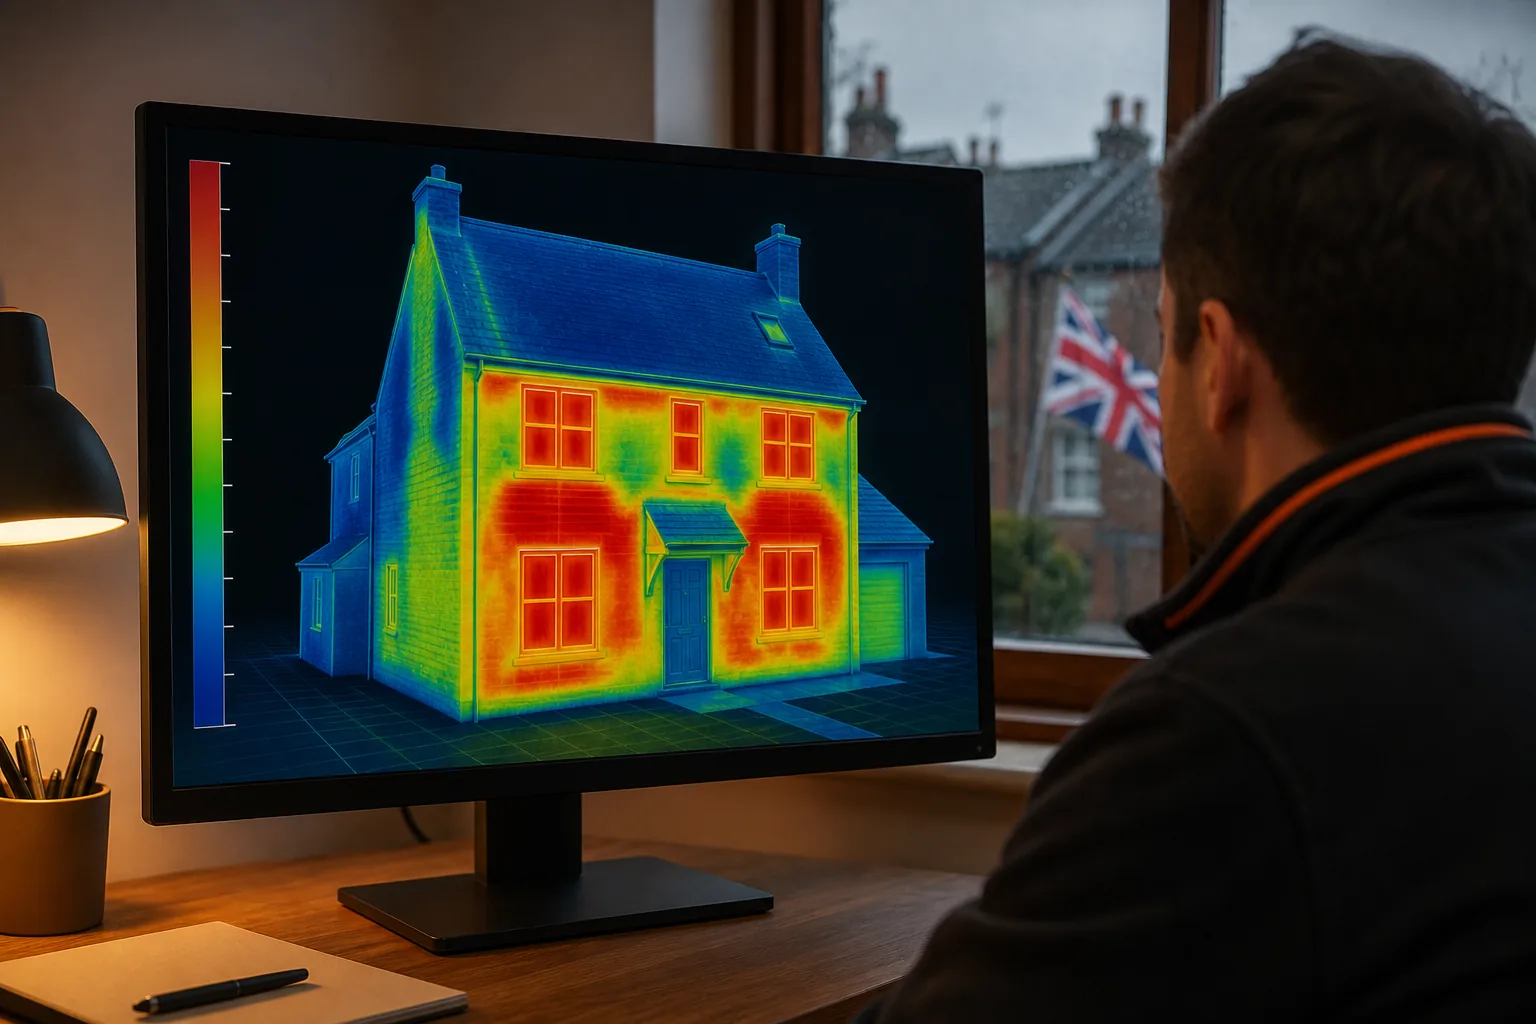
We also attach additional survey equipment when the roof has complex geometry. This creates a 3‑D point cloud that we later stitch into a model. The model lets us view heat loss on a façade, not just a flat image.
All data are stored securely and backed up within minutes of landing. Safety briefings, flight logs and GPS tracks are archived for compliance with PAS 2035 and building‑regulation records.
By now you should have a complete, geo‑referenced data set covering thermal, visual and 3‑D information.
Step 4: Interpret Thermal Anomalies and Validate Possible Heat Loss
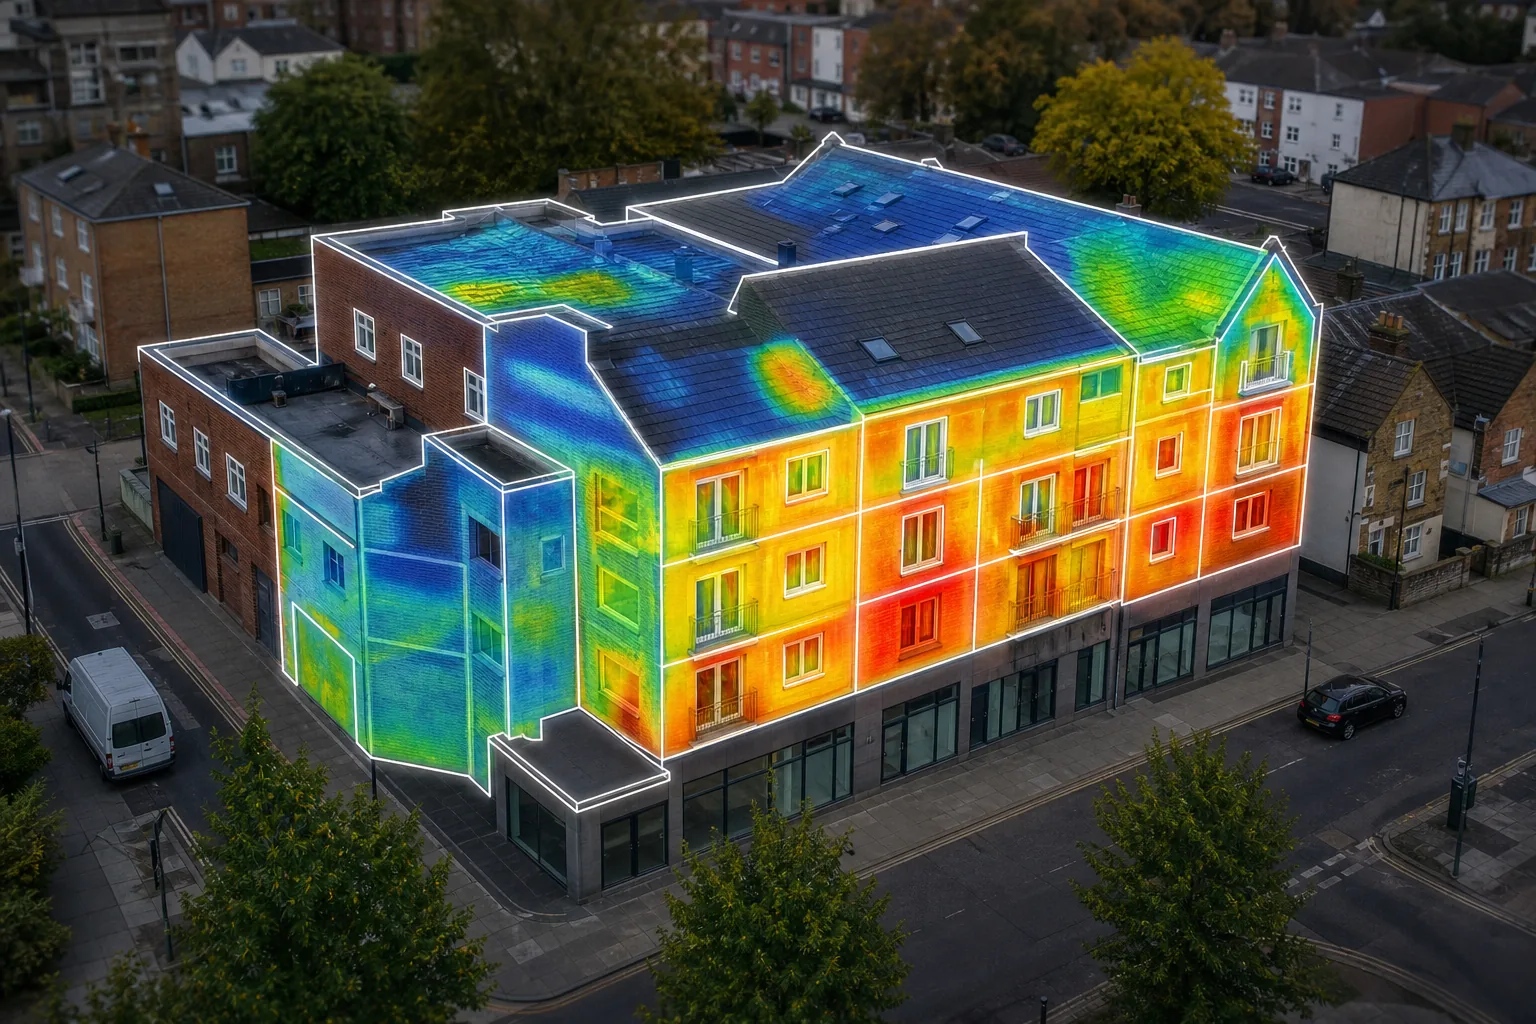
We start by loading the thermograms into analysis tools. The tool flags pixels that deviate more than 5 °C from surrounding areas, a common rule of thumb for significant heat loss.
Next we overlay the visual images to see if the hot or cold spots line up with cracks, gaps or service penetrations. If a cold spot sits over a window frame, it may be a thermal bridge. If a hot spot sits under a roof membrane, it could be moisture‑induced heat loss.
Validation can involve comparing the infrared data with a blower‑door test result or taking an additional temperature measurement. Consistency across methods builds confidence that the anomaly is real, not a sensor artefact.
Visual Perspectives adds a layer of 3‑D context, letting you walk a virtual tour of each anomaly and measure exact surface area. This data feeds directly into a heat‑loss calculation that meets IEC 62446‑3 reporting requirements.
By now you should have a shortlist of verified heat‑loss locations, each with a severity rating and a visual reference.
Step 5: Convert Findings into Retrofit and Maintenance Priorities
With a validated defect list, we rank each issue by cost‑impact and risk. Missing cavity insulation on external walls often scores high on energy‑saving potential, while a small roof moisture spot may be a maintenance‑only issue.
We produce a heat‑loss report that includes:
Each recommendation is linked to a compliance reference, PAS 2035 for retrofits, CIBSE guidelines for energy performance, and the PSDS Phase 4 eligibility criteria.
Our team then works with your facilities manager to translate the report into a phased investment plan. Priorities are set so you can secure funding now and schedule works when budgets allow.
By now you should have a clear, actionable retrofit roadmap that aligns with decarbonisation targets.
FAQ: Building Envelope Heat Loss Diagnostics
What is a building envelope heat loss diagnostic?
A building envelope heat loss diagnostic is a systematic inspection that uses thermal imaging, visual surveys and, often, blower‑door testing to locate where heat escapes a building.
How often should a heat loss survey be run?
For public‑sector estates the guidance in PAS 2035 recommends a full diagnostic every five years, or sooner if you notice rising energy bills or comfort complaints.
Can drones replace ladder inspections?
Yes, drones can capture high‑resolution thermal data on roofs and façades without the safety risks of ladders, especially on large or hard‑to‑reach sites.
Do I need a certified thermographer?
Absolutely. IEC 62446‑3 certification ensures the thermographer follows calibrated procedures and produces a report that regulators accept.
What data formats are delivered?
We deliver georeferenced thermal TIFFs, a 3‑D point‑cloud model (LAS format), and a PDF report that integrates both, ready to support facilities and building information workflows.
How does this help with PSDS Phase 4 funding?
The heat‑loss report provides the independent evidence required by the PSDS framework to justify retrofit funding and demonstrate net‑zero progress.
Independent, standards‑compliant diagnostics are the first step to effective decarbonisation. Contact Visual Perspectives Limited to schedule your building envelope heat loss survey and start saving energy today.
- Thermal images with annotated hotspots
- 3‑D model slices that show exact location
- Quantified heat‑loss figures (kWh/yr) for each defect
- Recommended retrofit actions (e.g., external wall insulation, roof membrane repair)