Running a building fabric heat loss assessment can feel like chasing shadows. Follow these five steps and you’ll have solid evidence of where your estate is losing heat, ready for retrofit decisions.
Step 1: Define the Assessment Scope and Building Fabric
Start by deciding which parts of the estate need attention, roofs, façades, cavity walls or service penetrations. Write a brief brief that lists the buildings, the floors, and the performance targets you expect (e.g., meet PSDS Phase 4 requirements). A clear scope stops the survey from becoming a wild goose chase.
Next, map the building fabric. Identify the construction type for each envelope element: solid‑wall, timber‑frame, cavity‑wall, flat roof, pitched roof, or pre‑fabricated panel. Knowing the fabric lets you choose the right thermal camera settings and the right flight altitude for drone work.
We at Visual Perspectives Limited always start with a scope document that matches the client’s retrofit roadmap. It ensures the heat‑loss data lines up with the asset‑management system you already use.
The amount of energy escaping a building depends on the temperature difference, the area of the fabric and its U‑value. By defining the fabric first you can calculate a rough baseline before you even point a camera at the wall.
Step 2: Gather Baseline Information Before Sitework
Collect the building’s existing documentation, construction drawings, past EPC reports, and any previous thermal surveys. If you can get the original specification of insulation thickness or glazing type, you’ll have a benchmark to compare against the new thermal images.
Run a quick walk‑through with a suitable temperature-measuring instrument. Record spot temperatures on walls, roofs and windows on a clear day. These point readings give you a sanity check for the drone‑captured data later.
Ask the facilities team for recent heating system data. Knowing the supply temperature and the building’s operating schedule helps you separate heat‑loss caused by fabric defects from that caused by system inefficiency.
When we worked with a regional NHS trust, the baseline data revealed that the heating set‑point was 2 °C higher than the design temperature, inflating the perceived heat‑loss by 15 %.
Finally, create a simple spreadsheet that lists each envelope element, its assumed U‑value, area and the expected heat loss. This spreadsheet becomes the backbone of your later analysis.
Step 3: Carry Out Thermal Imaging and External Inspection
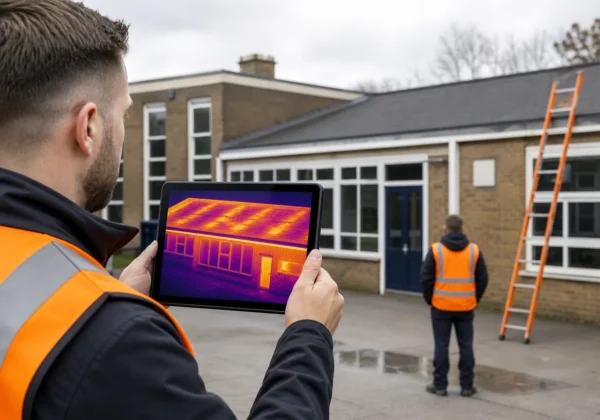
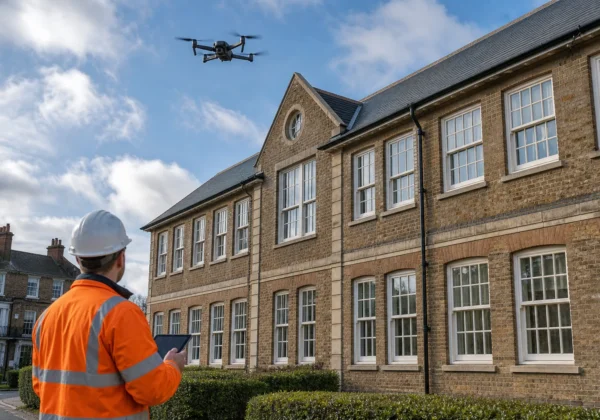
Plan the drone flight for a calm, dry day with minimal wind. Set the thermal camera to a resolution that captures at least 2 cm per pixel at the altitude you’ll be flying, this gives you enough detail to spot cold bridging and moisture pockets.
Launch the drone from a safe launch point. Fly a grid pattern that covers the roof and all façade elevations. Overlap each pass by 30 % to ensure no gaps in the thermal mosaic.
While the drone records thermal video, a technician on the ground walks the perimeter with a measuring device. They note any visible defects, cracked render, loose cladding, or roof penetrations, and tag the corresponding GPS points in the flight plan.
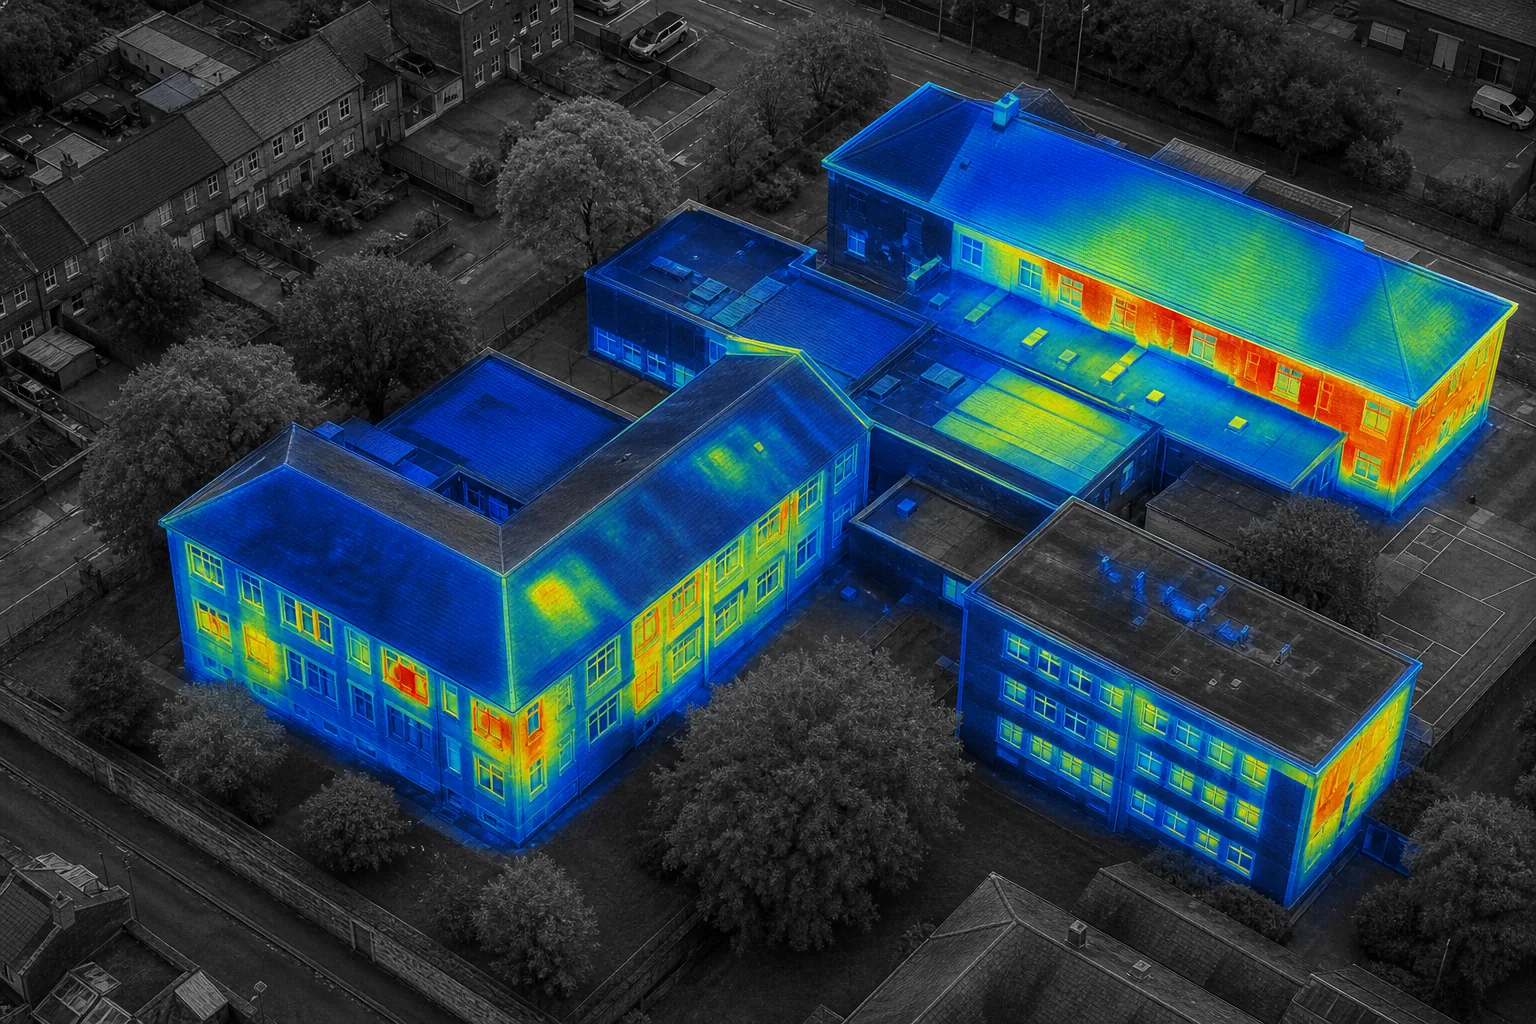
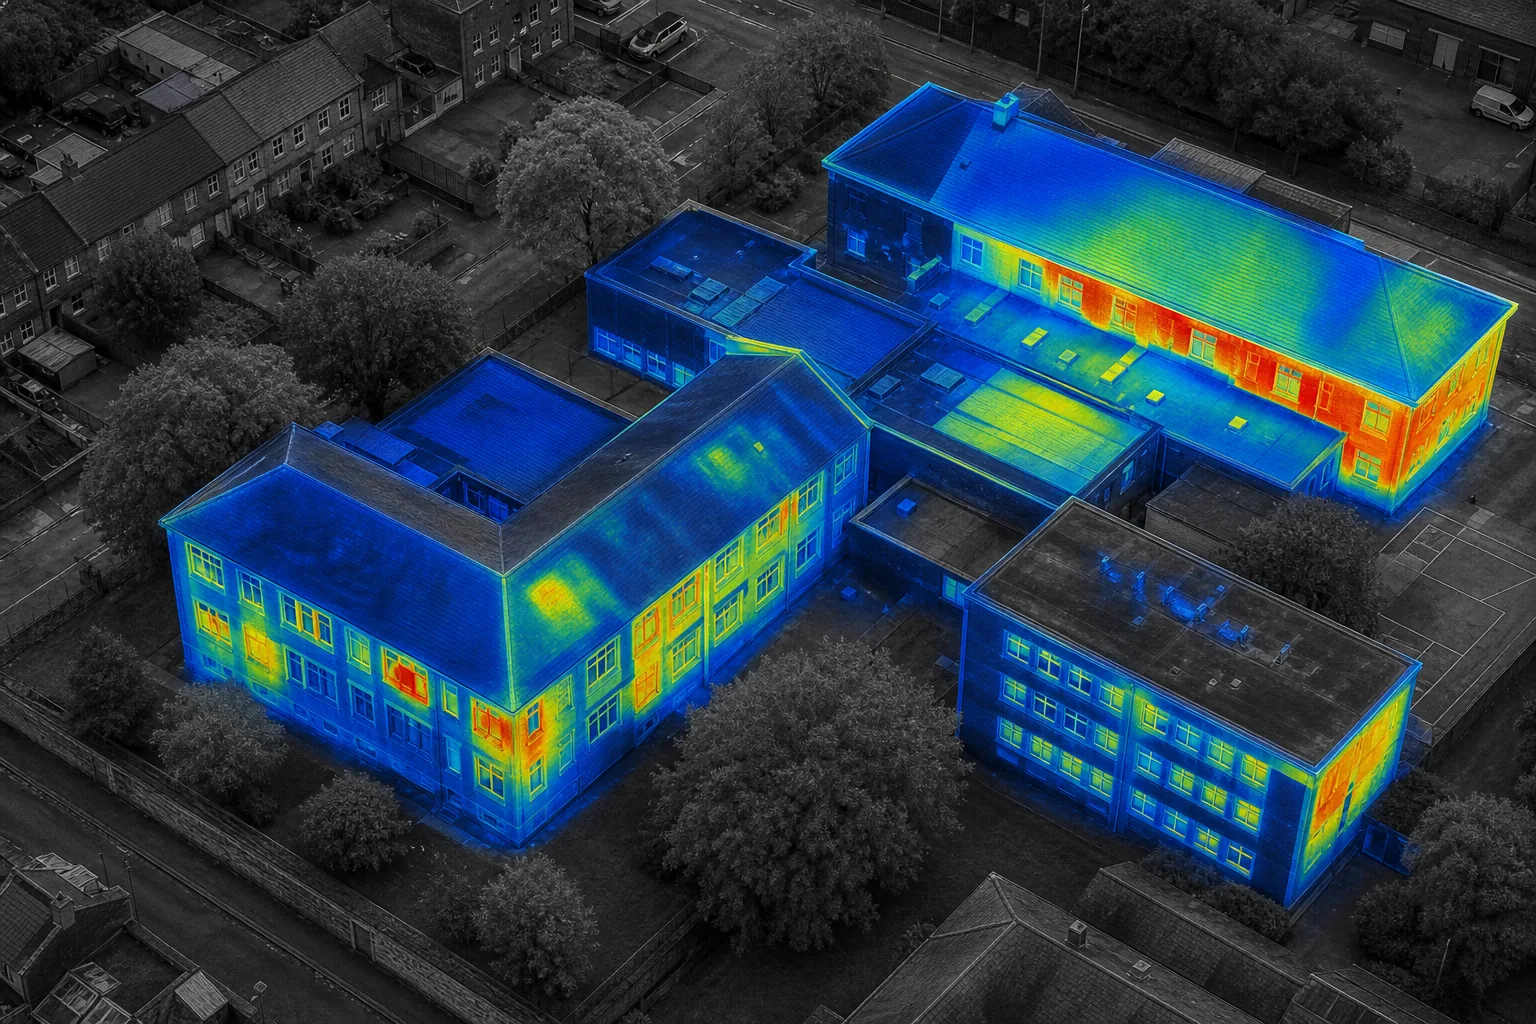
After the flight, stitch the thermal frames into an orthomosaic. The result is a colour‑coded map where red spots indicate heat loss and blue spots show colder areas.
Thermal orthomosaics provide evidence of the building fabric’s condition and can support further analysis.
Visual Perspectives Limited provides drone inspection, high-resolution thermal imaging equipment and clear reporting for compliance review.
Step 4: Interpret Heat‑Loss Patterns and Verify Defects
Open the orthomosaic in your analysis software. Look first for large red zones that line up with roof valleys, parapet walls or roof‑wall junctions, these are typical cold‑bridge locations.
Next, compare the thermal map with the on‑site notes you recorded. If a spot is hot on the map but you saw no visible defect, schedule a closer inspection using suitable inspection equipment.
Use the building’s geometry to calculate the area of each hot zone. Multiply the area by the temperature differential (outside minus surface temperature) and by a standard heat‑transfer coefficient to get an estimated heat‑loss value in watts.
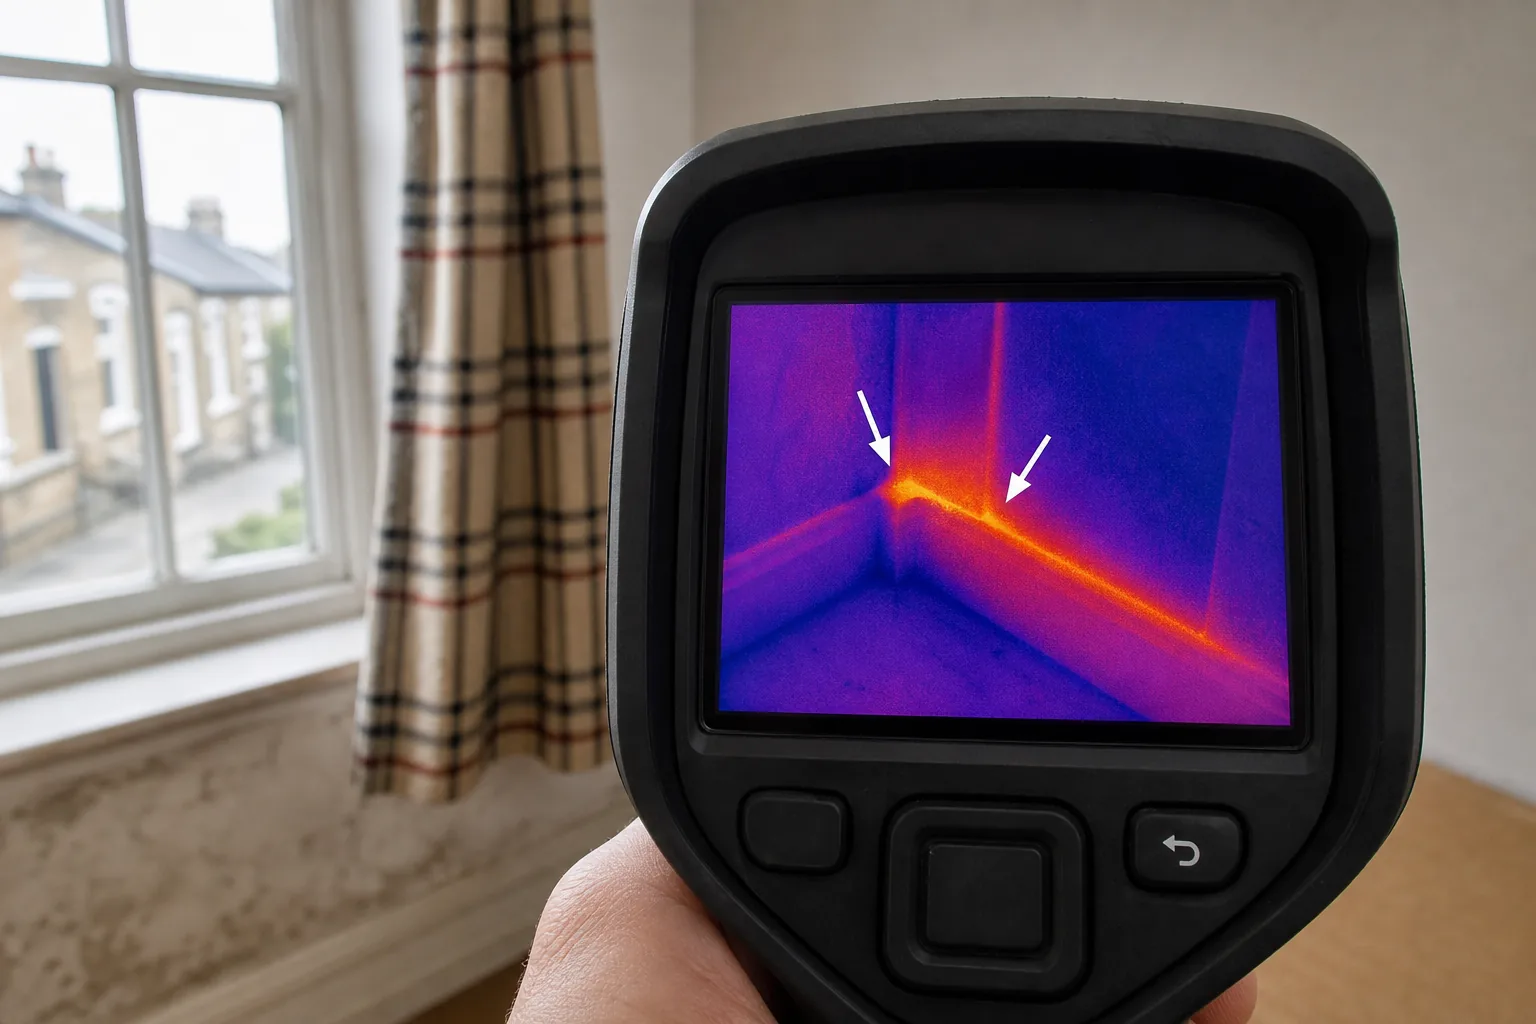
Thermal maps can highlight roof sections with temperature differentials, but those findings should be verified before repair decisions are made.
Document each defect with a thermal image, GPS coordinates and a short description. This creates a traceable evidence trail that auditors and funders will trust.
Step 5: Prioritise Remedial Work and Produce an Actionable Report
Rank each defect by its estimated heat‑loss contribution and its impact on occupant comfort. High‑impact items, large roof leaks, uninsulated wall sections, go to the top of the list.
Combine the heat‑loss numbers with the building’s energy‑use data to model the potential savings from fixing each defect. Show the client a simple “pay‑back” chart that links the cost of a repair to a reduction in annual heating costs.
Our final report packs a summary page, a detailed defect log, and a set of 3‑D models that can be imported into the client’s asset‑management system. The report follows IEC 62446‑3 formatting, so it can be submitted straight to the building control officer for PAS 2035‑aligned retrofit plans.
We recommend a phased remediation plan, fix the roof and external walls first, then move to cavity‑wall insulation and finally to service‑penetration sealing. This staged approach spreads costs and minimises disruption.
Visual Perspectives Limited can hand over the full data package, ready for your engineers to design the retrofit works. You’ll be in good hands.
FAQ
What is a building fabric heat loss assessment?
A building fabric heat loss assessment measures how much heat escapes through the envelope, walls, roof, floor and windows, using thermal imaging and on‑site measurements.
How accurate is drone‑based thermal imaging?
When the drone flies at the correct altitude and the camera is calibrated, the temperature reading is within ±2 °C, which is accurate enough for identifying major heat‑loss paths.
Do I need special permission to fly a drone for a heat‑loss survey?
Yes, the operator must hold the appropriate operational authorisation for the intended flight; requirements depend on the operation and location.
Can I use the thermal data for PAS 2035 retrofit design?
Absolutely, the IEC 62446‑3 compliant report we provide includes defect locations and heat‑loss estimates that feed directly into PAS 2035‑aligned retrofit specifications.
How long does a full estate heat‑loss assessment take?
Typical turnaround is 48 hours from flight to first‑pass report for a single building; larger estates are delivered in phases, each phase completed within a week.
Ready to see where your estate is losing heat? Read our heat‑loss survey guide for commercial buildings for deeper insight, then get in touch with Visual Perspectives Limited to schedule a drone‑based assessment.