Architects need clear, reliable data when they design or retrofit a building. An aerial survey gives you that data fast, safely, and with the detail you can trust. Below is a step‑by‑step guide that walks you through the whole process.
Step 1: Define the Design Question and Survey Scope
The first thing to do is write a short brief that says what you want to know. Are you checking roof drainage, looking for thermal bridges, or mapping the building footprint for a new BIM model? Spell out the exact questions so the drone team knows which areas to focus on.
Next, gather the documents the pilot will need: site plan, planning application drawings, and any local authority checklists. Supplying those up front cuts the back‑and‑forth that can delay a project. Measured Building Survey Explained
Finally, decide on the deliverables you expect. A typical package includes an orthomosaic, a georeferenced 3‑D model, and a thermal map if you need heat‑loss data. Knowing the output format early helps you match the survey to the software you already use.
Step 2: Prepare the Site, Permissions and Flight Plan
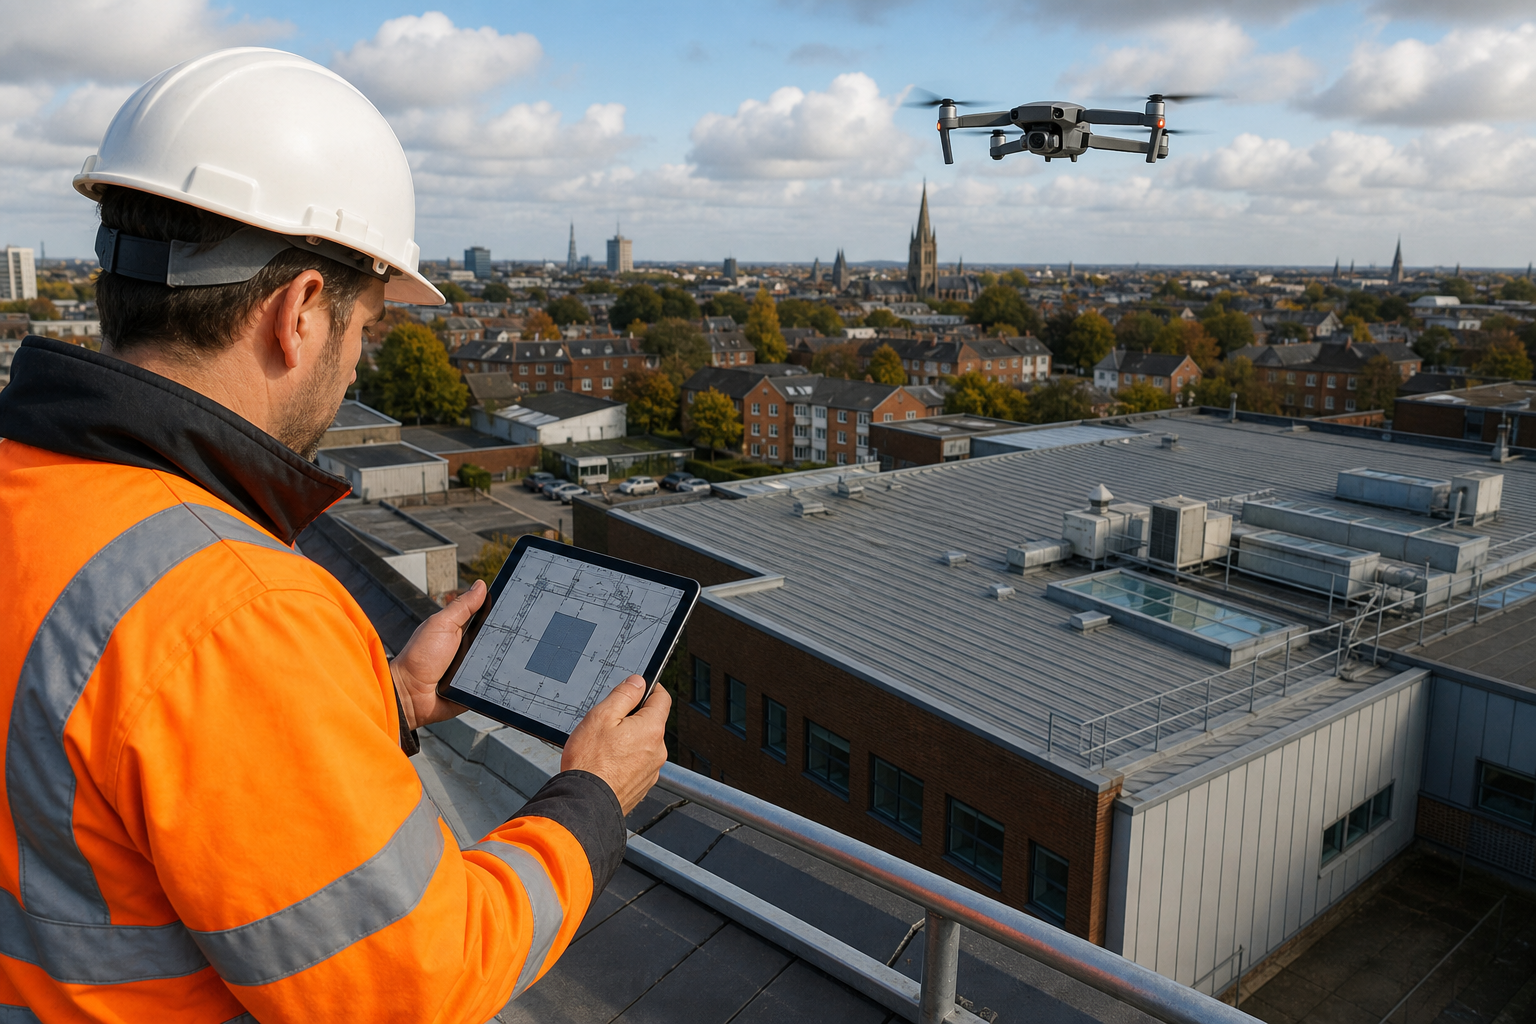
The pilot will assess the aircraft weight, the proximity of people, and any nearby air‑space restrictions before filing the paperwork.
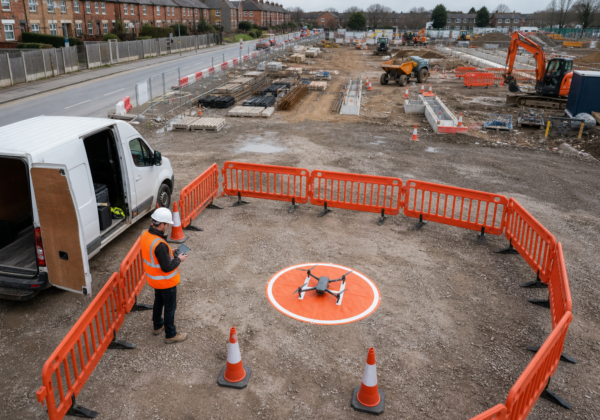
Ask the building manager for a clear launch area and a safe landing zone. Remove loose objects that could be knocked over by the rotors. If the site sits inside a flight‑restriction zone, you’ll need permission from the airport authority or the local council.
Insurance is another must‑have. A suitably insured operator carries public‑liability cover that protects both the pilot and the client. The paperwork should list the aircraft’s registration, the pilot’s licence, and the risk‑assessment for the specific site. aviation guidance
Once the legal side is sorted, the pilot creates a flight plan. The plan defines flight altitude, overlap percentage (usually 70 % for a smooth orthomosaic), and the sequence of waypoints. A well‑written plan reduces the chance of missing a hard‑to‑reach roof valley or a concealed façade detail.
Step 3: Capture the Right Visual, 3D and Thermal Data
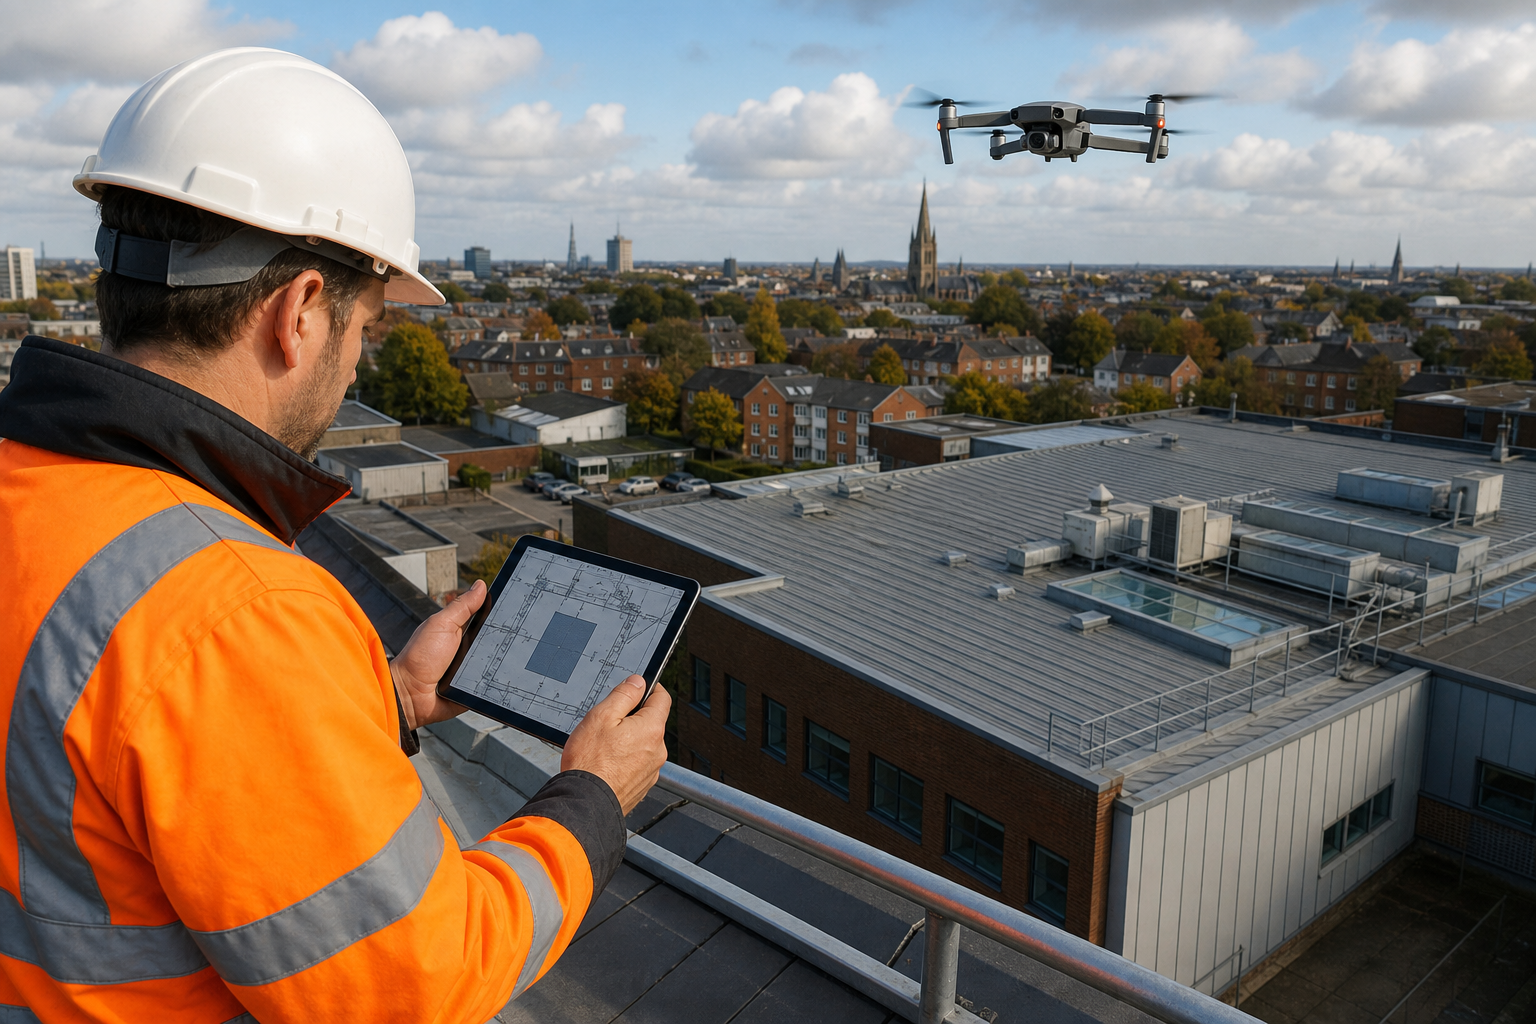
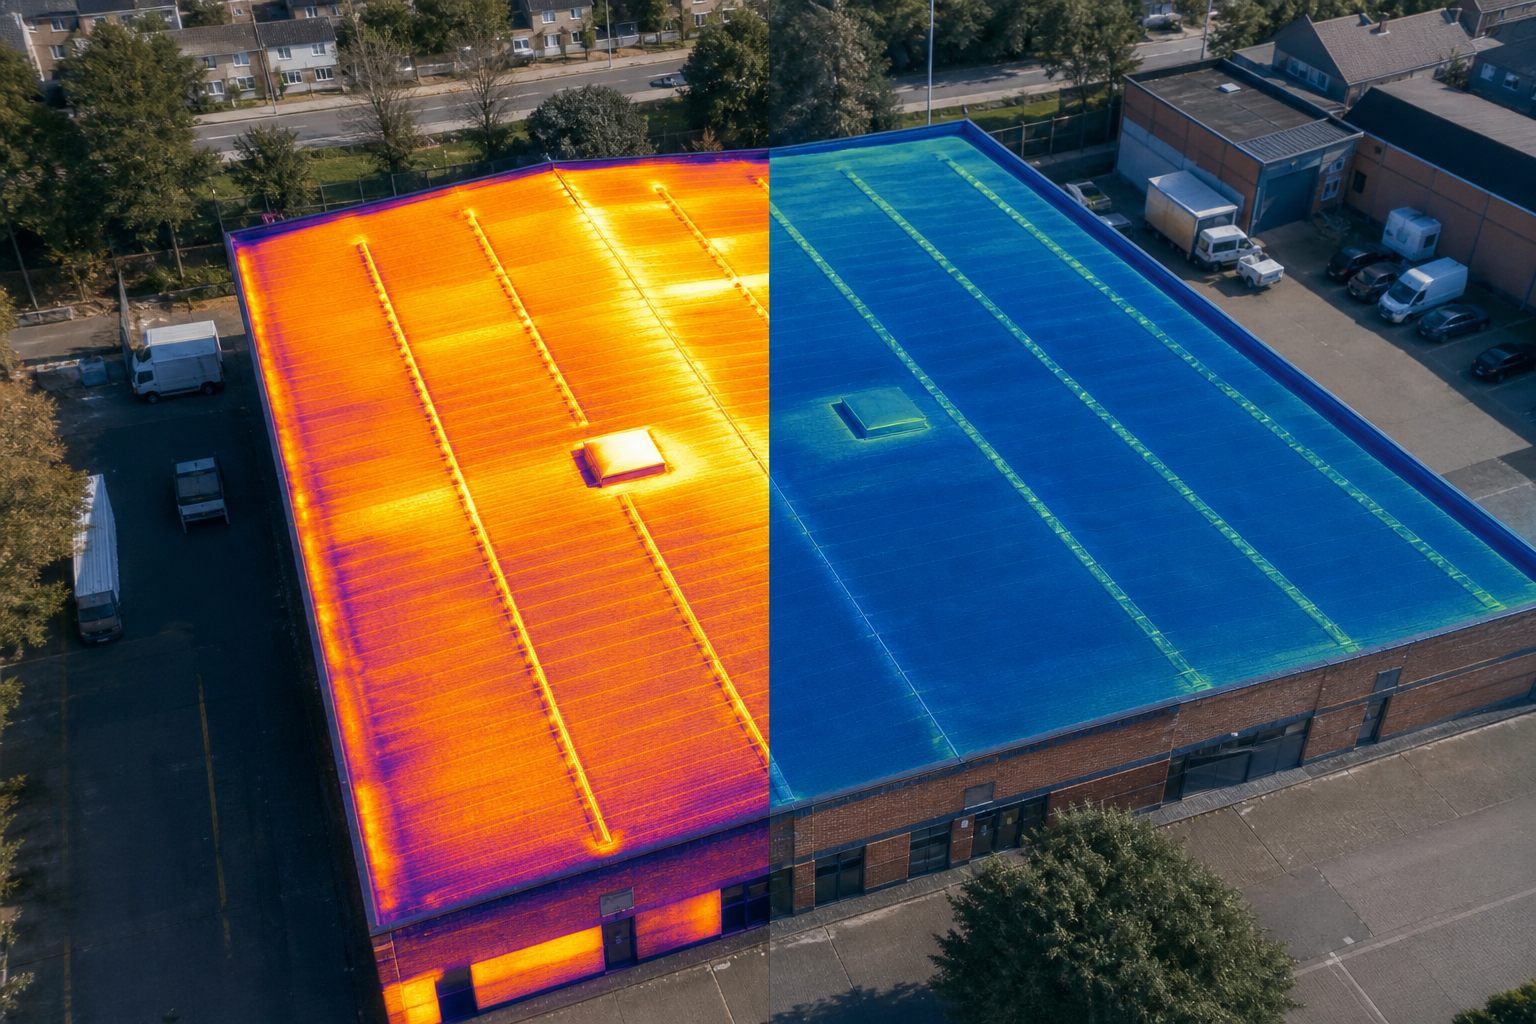
On the day of the survey, the drone takes two passes: a high‑resolution RGB pass for visual detail, and a thermal pass for heat‑loss detection. The thermal camera should be set to radiometric mode so each pixel records an actual temperature.
Fly the thermal pass just after sunset when the building interior is still warm and the exterior has cooled. That contrast makes hot spots stand out clearly.
For the 3‑D model, the drone uses either photogrammetry or a lightweight LiDAR sensor. Photogrammetry stitches overlapping photos into a dense point cloud; LiDAR records distance with laser pulses and can capture complex geometry under shadows.
After the flight, the raw files are downloaded to a secure laptop. The operator checks for blurry frames, missing overlap, or GPS glitches. Any gaps are fixed with a quick re‑flight before the crew leaves the site.
When you need a quick look at roof geometry, a top‑down orthomosaic gives you a flat map that can be imported into CAD or BIM. For detailed façade work, an oblique view adds depth and lets you see window frames and roof penetrations from the side. Best Topographic Survey Drones for Commercial Buildings 2026
Step 4: Turn Survey Outputs into Design‑Ready Evidence
Raw data is only useful once it’s turned into a clear, actionable report. First, the point cloud is cleaned and registered to a real‑world coordinate system. Then the cloud is imported into a BIM authoring tool such as Revit or ArchiCAD.
In the BIM model you can attach defect tags, measurement call‑outs, and thermal overlays. A roof sag, for example, appears as a deviation from the expected plane and is labelled with the exact dip in millimetres.
The thermal map is over‑laid on the visual orthomosaic. Hot spots that exceed a 5 °C delta from the indoor set‑point are flagged as potential heat‑loss paths. Those flags become rows in a defect table that includes location, temperature delta, likely cause, and a recommended fix.
Finally, the report is compiled in a format that matches industry standards. For projects that involve solar PV, the report follows IEC 62446‑3, which mandates sections on module temperature and string‑level performance. For broader building retrofits, the report cites PAS 2035 and CIBSE guidance on fabric performance.
The finished package, BIM model, orthomosaic, thermal map, and defect table, feeds directly into the architect’s design workflow. You can pull exact measurements into the design, run energy‑simulation tools, and hand the data to contractors for cost estimation. Best Drone Building Survey Services for UK Commercial …
Step 5: Validate Findings and Apply Them to Retrofit or Construction Decisions
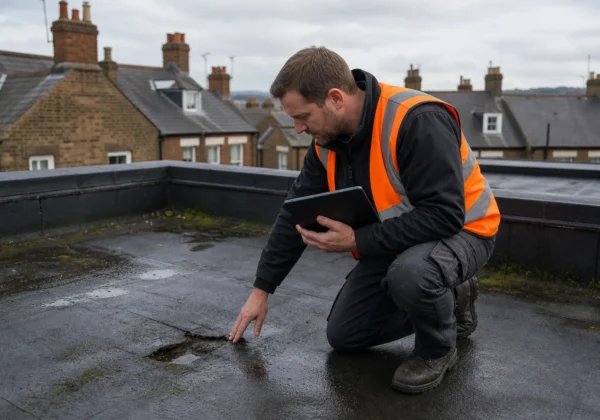
Before you hand the data to a design team, double‑check the key findings. Compare the drone‑captured measurements against any existing as‑built drawings. Small mismatches can signal settlement or deformation that needs further investigation.
Next, run a quick cost‑benefit analysis. The defect table already ranks issues by temperature delta; those with the highest delta typically deliver the biggest energy savings when fixed. Prioritise roof membrane repairs, insulation upgrades, and window‑frame sealing before tackling lower‑impact items.
When the retrofit is complete, schedule a follow‑up flight. Run the same thermal pass and overlay the new map on the baseline. If the hot‑spot temperature has dropped by at least 80 %, the fix is successful and you have hard evidence for ESG reporting or insurance claims.
For large public‑sector estates, this evidence chain satisfies PSDS Phase 4 requirements. It shows that you have measured the building’s current performance, identified the most cost‑effective interventions, and verified that the work delivered the expected improvement.
Visual Perspectives Limited can manage the entire workflow, from planning permissions to final validation, so you stay focused on the design. Their CAA‑licensed pilots, IEC‑62446‑3 compliance, and fast turnaround make them a reliable partner for any architectural project.
FAQ: Aerial Surveys for Architects
What does an aerial survey actually deliver for an architect?
An aerial survey provides a georeferenced orthomosaic, a 3‑D point cloud or BIM model, and (if required) a thermal map that highlights heat‑loss paths. Those deliverables give you accurate geometry, defect locations, and energy‑performance data that can be fed straight into design software.
Do I need a special licence to commission a drone survey?
Yes. The operator must hold a CAA Operator ID and, for most roof work, a Specific Category Operational Authorisation. The pilot also needs a valid Remote Pilot Certificate and appropriate insurance.
How accurate are the measurements from a drone‑generated 3‑D model?
Modern photogrammetry or lightweight LiDAR can achieve ±30, 50 mm accuracy for roof geometry and ±2 mm for close‑range handheld scans. That level of precision meets most planning and retrofit specifications.
Can thermal data be used for building regulations compliance?
Thermal data that follows IEC 62446‑3 is accepted for solar‑PV inspections and can support PAS 2035 heat‑loss calculations. It provides quantitative evidence of insulation gaps, moisture, and thermal bridges.
How long does a full survey take from start to final report?
A typical commercial roof survey takes half a day to fly, plus one to two days for processing and report generation. Faster turnaround is possible when the scope is limited to visual and thermal imagery only.
Is a drone survey safe for historic or listed buildings?
Yes, when the flight plan respects exclusion zones and the pilot follows the CAA’s safety guidelines. Drones avoid the need for scaffolding, which reduces the risk of damage to delicate fabric.
For a smoother retrofit, start with a compliant aerial survey and let the data drive your design decisions. Explore our heat‑loss survey guide to see how the process fits into a net‑zero strategy.