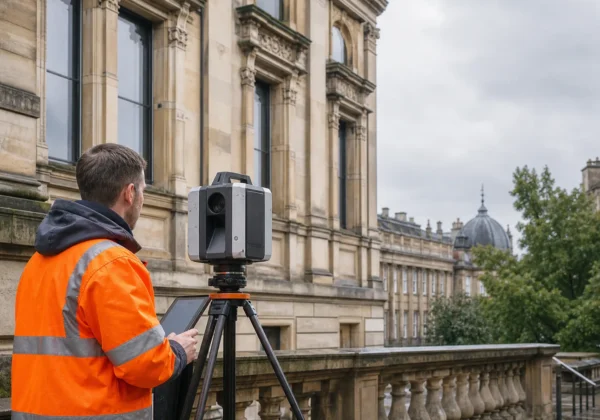
Need a true 3‑D picture of a building fast? A point cloud survey gives you that , and it also shows heat loss that the naked eye can’t see. Below we explain what it is, how it’s captured, what you get and how accurate it can be.
What Is a Point Cloud Survey?
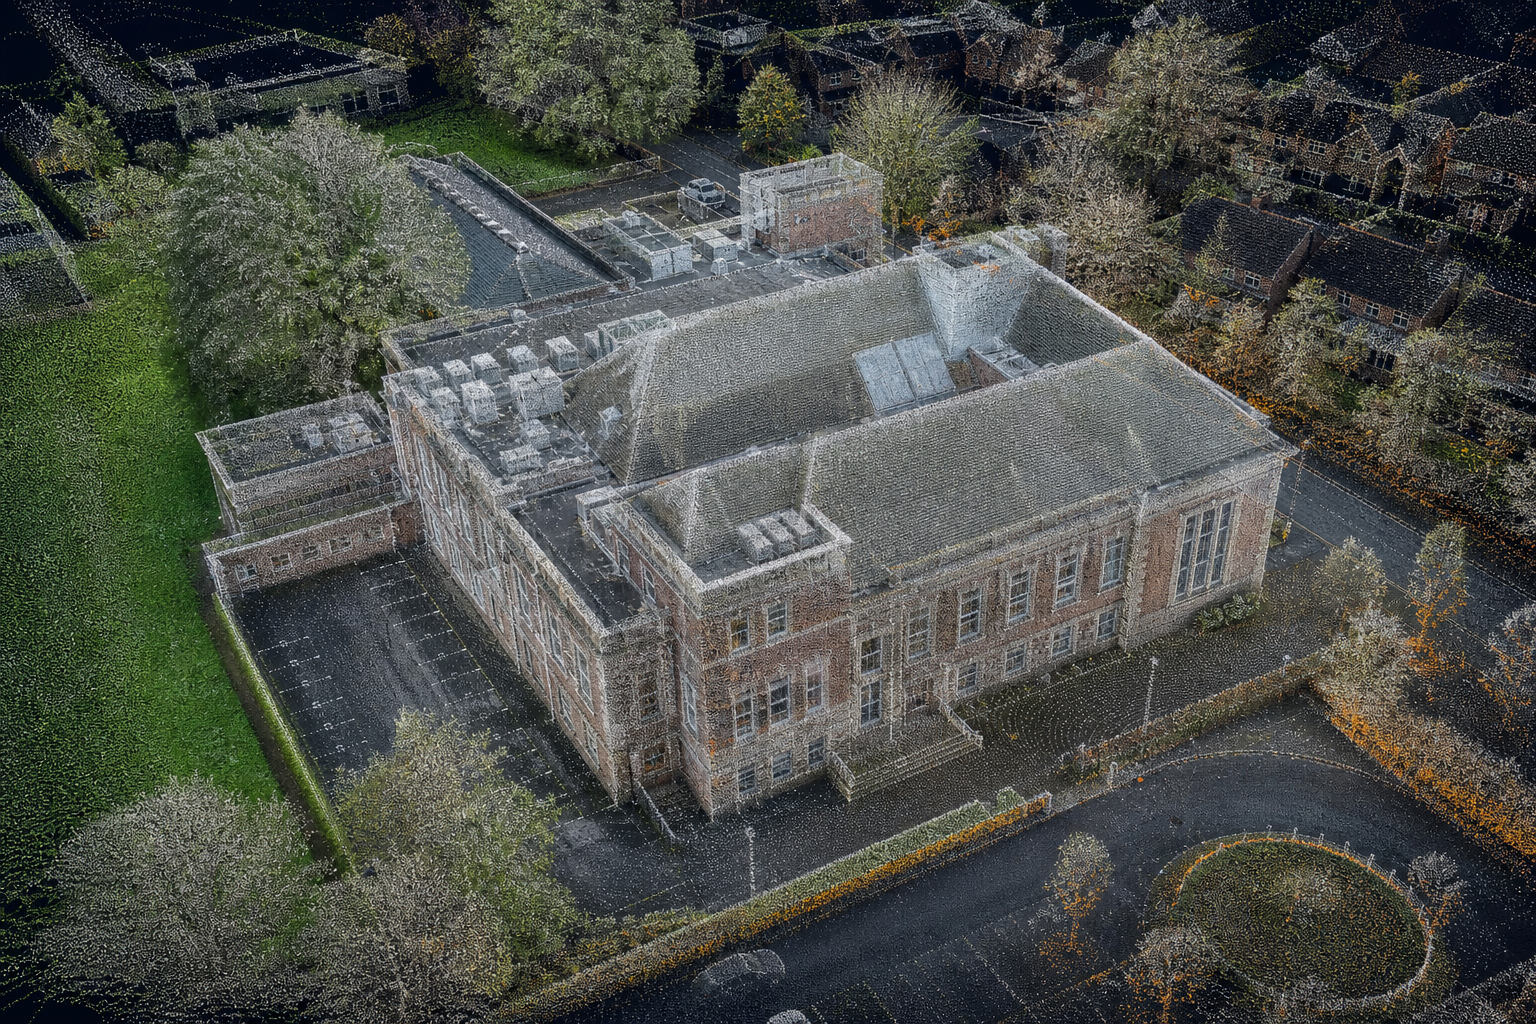
A point cloud survey records a large number of X, Y, Z points that map every surface of a structure. The result is a dense “cloud” of data that can be turned into a 3‑D model, a CAD file or a BIM element.
It works for architects, engineers and facilities managers who need precise measurements without touching the building. The technique is common in the AEC sector, heritage recording and asset management.
The points are usually captured by laser scanners or photogrammetry‑based cameras. The more points you collect, the finer the detail you can see , down to a few millimetres on a roof tile.
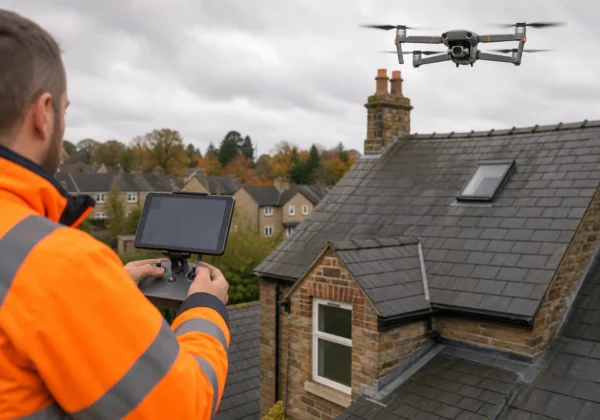
One big benefit is safety: you can map high or hard‑to‑reach areas from the ground or a drone, avoiding scaffolding. That saves time and reduces risk for your crew.
But point clouds are only as good as the capture plan. Gaps in coverage or poor lighting can leave holes that later need a second visit.
How Point Cloud Data Is Captured and Processed
We start with a site walk‑through. The team notes access routes, potential obstacles and sets up ground‑control points that tie the data to the national grid.
Next, a CAA‑licensed drone lifts a high‑resolution RGB camera and an IEC 62446‑compliant thermal sensor. The drone flies a grid pattern, overlapping images by at least 70 % forward and 80 % side. Those overlaps let the software stitch the photos into a dense point cloud.
While the drone flies, the thermal camera records temperature data for every pixel. After landing, we download raw files and run them through photogrammetry software that builds three outputs: a colour‑accurate orthomosaic, a Digital Surface Model (DSM) and the raw point cloud.
We then align the point cloud to the ground‑control points, giving it real‑world coordinates. The cloud is cleaned of stray points, merged with any LiDAR passes, and finally exported in formats like LAS, LAZ, OBJ or DWG.
Because we use both photogrammetry and thermal imaging, the final dataset lets you see geometry and heat loss in one package , a rare combination in the UK market.
Our workflow finishes with a quality‑assurance check: we compare a handful of cloud points against a total‑station survey. If the deviation stays within the tolerance set in the brief, we sign off the data and move to reporting.
What Can a Point Cloud Survey Deliver?
Every drone flight yields three core deliverables, all georeferenced to survey‑grade accuracy. The first is an orthophoto , a distortion‑free top‑down image you can measure directly.
The second is a Digital Surface Model. That height map captures every roof ridge, chimney and surrounding terrain, ready for volume calculations or flood‑risk analysis.
The third is the 3‑D point cloud itself. From it you can extract roof pitch, tile layout, façade details and even hidden structural elements. The data can be fed straight into CAD, BIM or GIS tools in formats like GeoTIFF, DXF or IFC.
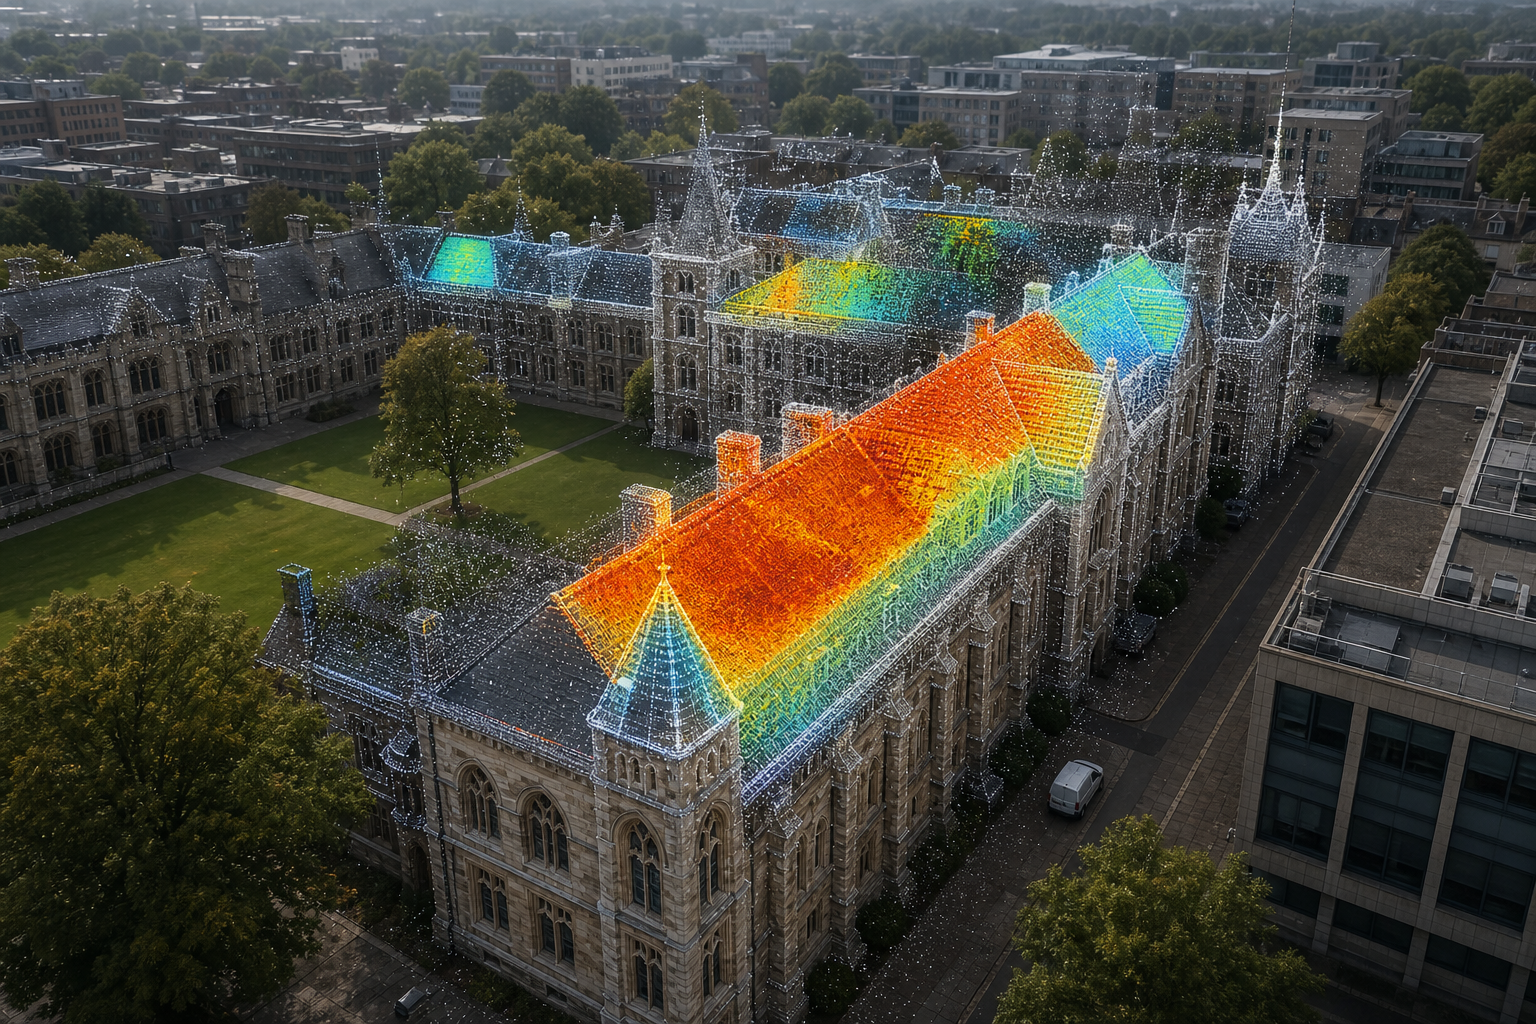
Because we also capture thermal data, you get a colour‑coded heat map that highlights temperature differences greater than 5 °C. Those spots often point to moisture, insulation gaps or faulty flashings , exactly the issues that cause costly repairs later.
All outputs arrive with an accuracy statement, a revision log and a short user guide that explains how to import the files into common design software.
Need a quick reference on how to set up the data for BIM? Check out How to Run a 3D Building Survey for Planning, it walks you through the exact steps we follow.
Accuracy, Resolution and Quality Assurance
Accuracy in a point cloud has two faces: relative accuracy (how close points are to each other) and absolute accuracy (how well the cloud aligns to real‑world coordinates). Our drone‑photogrammetry method typically delivers relative accuracy of 1, 3 mm and absolute accuracy within 5 cm when ground‑control points are used.
Resolution depends on flight altitude and camera sensor. Flying at 30 m over a flat roof can produce point densities of 2000 points / m², enough to spot a broken tile. Higher altitudes lower density but cover larger areas faster.
Quality assurance starts on‑site with a control‑point check, continues in‑software with automated error‑detection, and ends with a manual spot‑check against known benchmarks.
Point‑density figures are not always disclosed, making it harder to compare quality across suppliers.
Registration methods, including coarse‑to‑fine strategies for merging multiple scans, are relevant to LiDAR registration.
In practice, we run a final “cloud‑to‑ground” test: a subset of cloud points is measured with a total‑station, and the deviation is logged. If the error exceeds the tolerance, we re‑fly the affected area.
Bottom line: our 48‑hour “snapshot” service gives you a fast, precise and detailed dataset that meets both geometric and thermal standards.
Where Point Cloud Surveys Add Value in Public Sector Estates
Local authorities, NHS trusts and universities all face huge retrofit programmes under PSDS Phase 4. A point cloud survey gives them the factual evidence they need to prioritise work.
Take a typical school estate: the roof, façade and mechanical plant are spread across several blocks. A single drone flight captures every surface, producing a 3‑D model that the estate manager can slice to view insulation gaps, roof sag or blocked drainage.
Because the data includes thermal imagery, you can spot heat loss that would otherwise require a manual walk‑around. That lets you target the most energy‑inefficient zones first, supporting net‑zero targets.
In a recent NHS hospital inspection, a point‑cloud‑based heat map revealed three roof sections with temperature differentials over 10 °C. Those sections were later repaired, cutting heating demand by an estimated 12 %.
Asset managers also use the DSM to calculate volumes for earthworks or to check that new extensions sit within planning limits. The orthophoto overlays onto existing GIS layers, giving a smooth view of the whole campus.
For more on how to turn a point cloud into a measured building survey, read Measured Building Survey Explained. It shows the exact workflow we follow for public‑sector clients.
Limitations and What to Specify Before Commissioning a Survey
No technology is perfect. Point clouds can miss hidden surfaces , the back of a deep recess or a cavity wall behind a façade may stay invisible unless you add extra viewpoints.
Weather also matters. Heavy rain, strong wind or bright sunlight can create noise points or blur images, forcing a re‑flight.
Data size can be a challenge. A full‑scale campus survey can generate tens of gigabytes of points, which demands powerful workstations for processing.
Before you sign a contract, ask the provider for three things:
- Proof of CAA licence and IEC 62446 compliance for thermal work.
- Details of the ground‑control strategy and expected absolute accuracy.
- Turn‑around time for raw data, processed outputs and QA reports.
Make sure the deliverables list includes the formats you need , LAS or LAZ for point clouds, GeoTIFF for orthophotos, and IFC or Revit files for BIM integration.
If you need to merge the new cloud with existing CAD drawings, verify that the provider will supply a transformation matrix or an alignment report.
Finally, confirm who owns the raw data. Independent ownership means you can reuse the files for future surveys without extra cost.
FAQ
What equipment is used for a point cloud survey?
A point cloud survey typically uses a CAA‑licensed drone equipped with a high‑resolution RGB camera and an IEC 62446‑compliant thermal sensor, plus ground‑control markers for georeferencing.
How long does a typical survey take?
For a medium‑size commercial roof, the flight itself takes 30, 45 minutes; processing and QA usually finish within 48 hours, giving you a rapid turnaround.
Can point clouds replace a traditional measured survey?
They can provide the same geometric accuracy for most design and maintenance tasks, but you may still need a total‑station check for critical structural elements.
Is the data compatible with BIM software?
Yes , we deliver point clouds in LAS/LAZ, and we also provide IFC or Revit families that import directly into most BIM platforms.
What level of accuracy can I expect?
With proper ground‑control points, our drone‑photogrammetry method delivers absolute accuracy within 5 cm and relative accuracy of 1, 3 mm, which meets most public‑sector specifications.
Conclusion
For UK public‑sector estates, Visual Perspectives Limited offers the most complete point cloud survey , fast, precise, and detailed, with thermal imaging that meets IEC 62446. Request a scoped quote today and lock in a flight window that matches optimal weather conditions.