Heat loss on a commercial roof can cost you thousands in wasted energy and hidden repairs. A heat loss survey shows where the building leaks, how the roof and solar panels are performing, and what you can fix before a problem blows up. In this guide we’ll walk through what a heat loss survey is, how drones and thermal cameras do the work, why it matters for roofs and PV arrays, and how to stay compliant with IEC 62446. You’ll finish with a quick FAQ and a clear next step.
What Is a Heat Loss Survey?
A heat loss survey is a systematic inspection that maps temperature differences across a building envelope. It uses infrared (IR) cameras to capture the heat that each surface emits. Those images are then compared to indoor temperature data to spot cold spots, insulation gaps, or air leakage. The process works for new builds, refurbishments, or routine maintenance.
Key steps include:
- Gathering inside‑and‑outside temperature readings.
- Scanning walls, roofs, windows, and any exposed services.
- Analyzing the thermal maps with software that flags anomalies.
Why do owners commission a heat loss survey? For new commercial buildings it proves compliance with Part L of the Building Regulations. For existing assets it provides before‑and‑after data that backs up retrofit decisions. It also feeds into BREEAM assessments and helps meet decarbonisation targets.
Below is a quick decision matrix that helps you decide when a heat loss survey is worth the investment.
Because the heat loss survey captures data that the naked eye can’t see, you end up with a clear, actionable report that cuts guesswork. ScanTherm explains how high‑resolution thermal cameras speed up the assessment. You’ll be in good hands.
How Drone Thermal Imaging Performs Heat Loss Surveys
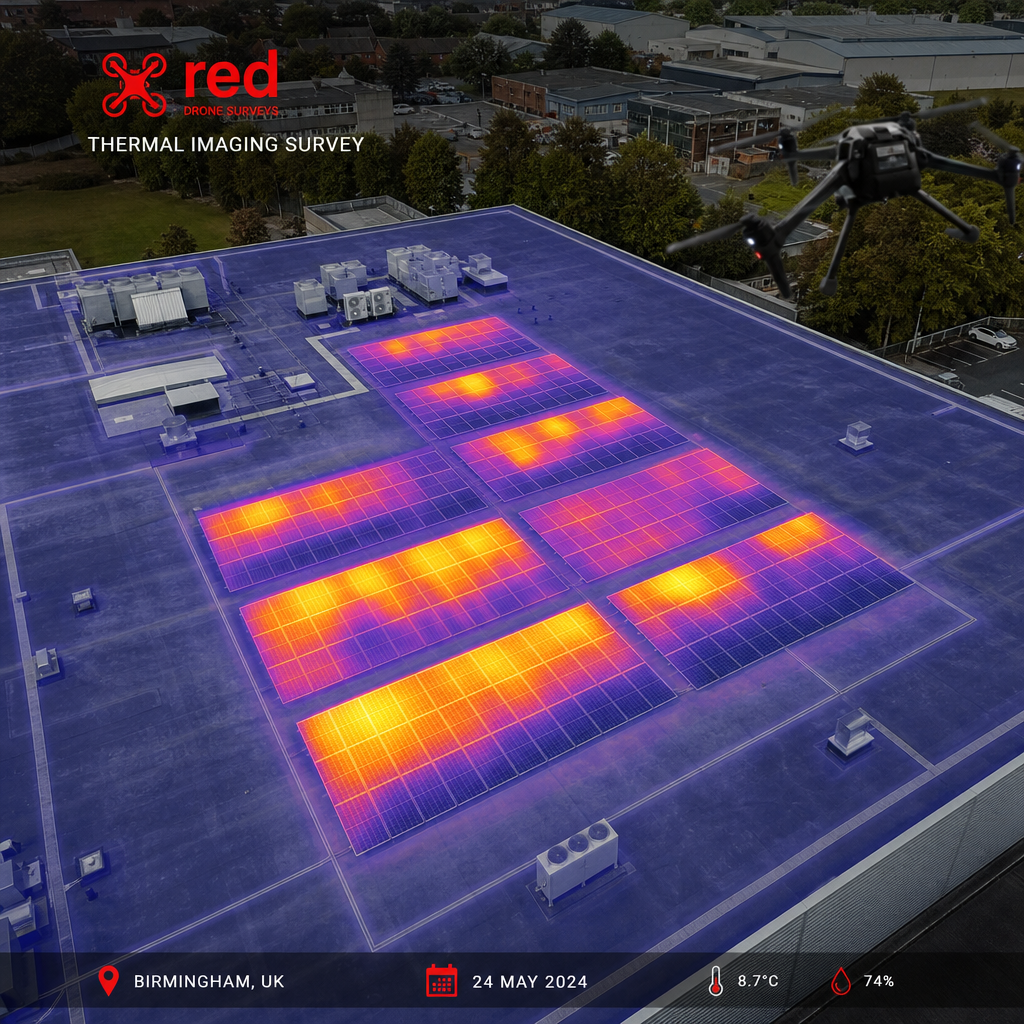
Drones equipped with calibrated IR sensors fly over the roof, façade, and solar arrays, capturing overlapping images that software stitches into a smooth thermal map. The flight plan is programmed to keep the camera at a constant distance and angle, ensuring consistent data quality.
Because the drone hovers above hard‑to‑reach areas, you avoid scaffolding, rope access, and the associated safety risks. The result is a “quickly, precise, and detailed” survey that can be completed in a single day for most commercial sites.
During the flight the drone logs GPS coordinates for every frame. That geo‑tagging lets the post‑processing software overlay the thermal data onto a 3‑D point cloud of the building. The final report includes:
- A colour‑coded heat map that highlights hot and cold zones.
- Measurements of temperature differentials in degrees Celsius.
- Annotations that point out probable causes , for example, missing insulation or a leaking PV junction.
Visual Perspectives uses drones that are CAA‑approved and pilots who hold ITC Level 1 & 2 certifications. That combination meets the strictest UK safety standards while delivering data that aligns with IEC 62446 requirements.
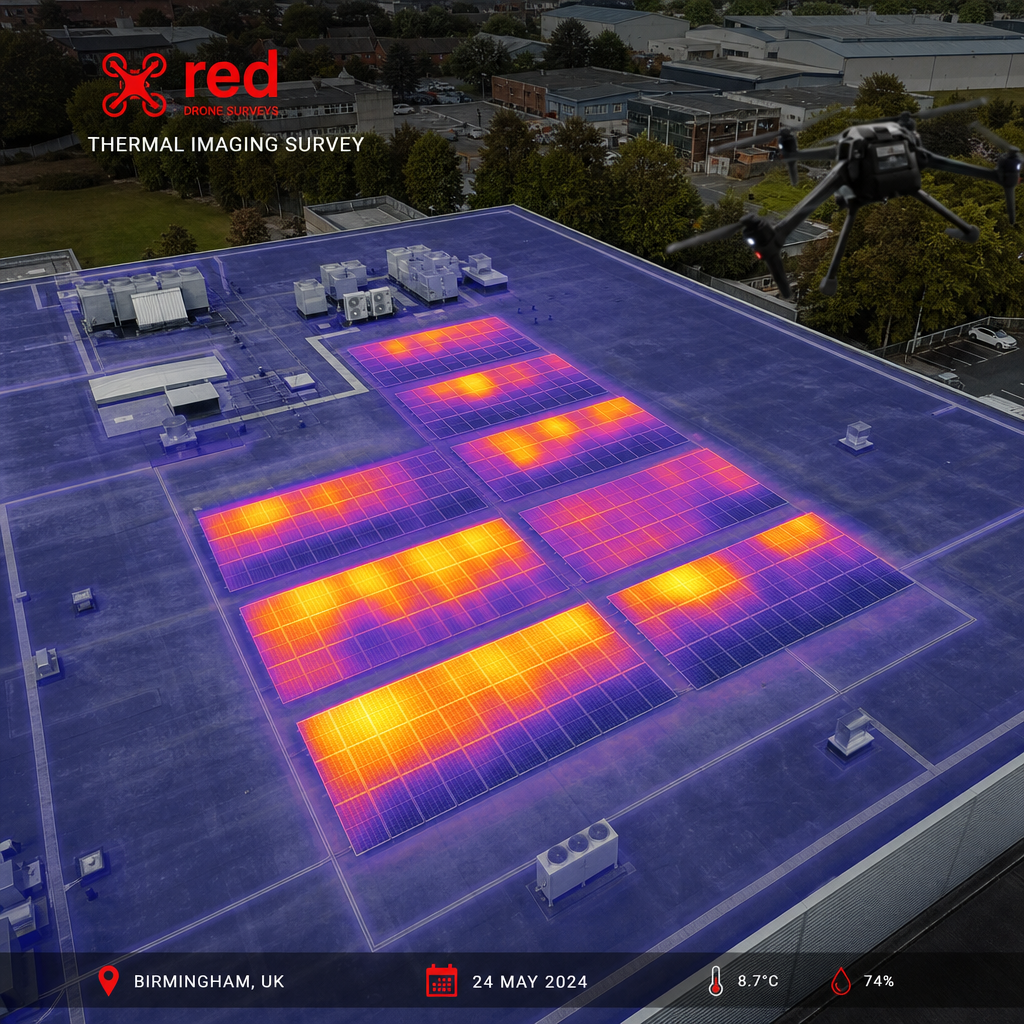
For a deeper look at why thermal imaging is a game‑changer, watch the short video below.
After the flight, the raw data is processed with industry‑standard software that calibrates for emissivity, distance, and ambient temperature. This step turns raw pixel values into accurate temperature readings that you can trust for engineering decisions.
Benefits of Heat Loss Surveys for Commercial Roofs and PV Systems
Thermography uncovers hidden defects that traditional visual checks miss. For roofs, it spots water ingress, delamination, and insulation gaps. For PV arrays, it finds hot‑spots, shading issues, and connector failures that can reduce output and pose fire risks.
Buildings in the UK account for about 40 % of total energy use. Reducing heat loss can shave a noticeable amount off utility bills and help meet carbon‑reduction targets. A well‑executed survey gives you a clear path to:
- Prioritise repairs that deliver the highest energy savings.
- Validate the performance of newly installed solar panels.
- Document compliance for ESG reporting.
One study highlighted a 15 % boost in energy efficiency after sealing identified air leaks on a commercial office block. While the exact number comes from a sector‑wide analysis, it shows the scale of savings you can expect.
Thermal imaging also speeds up the audit process. What used to take days of manual inspection can now be done in a few hours, freeing your facilities team to focus on remediation rather than data collection.
Because Visual Perspectives provides an IEC 62446‑compliant report, you get a document that meets grid‑connection standards for solar installations. That report can be handed straight to the utility or used in a building‑performance certification.
Conducting an IEC 62446‑Compliant Heat Loss Survey
IEC 62446 sets the test and documentation standards for grid‑connected PV systems. To stay compliant, a heat loss survey must capture thermal data in a format that matches the standard’s reporting structure.
The workflow looks like this:
- Pre‑flight briefing: Verify that the drone’s IR sensor is calibrated to ISO‑standard emissivity values.
- Flight execution: Capture thermal images of each PV module, inverter, and mounting structure.
- Data stitching: Merge images into a single orthomosaic that aligns with the electrical layout diagram.
- Analysis: Flag any module that exceeds the 2 °C temperature rise threshold defined by IEC 62446.
- Reporting: Produce a PDF that includes thermal maps, temperature tables, and a compliance checklist.
The final report must contain a “thermal performance” section that lists the maximum and average module temperatures, along with any deviations from expected values. It also needs a clear visual of the thermal map overlaid on the PV array layout.
Visual Perspectives follows this exact process, delivering reports that pass IEC 62446 audits without extra work from your side. The company’s 20 years of experience mean the team knows the common pitfalls , like reflections from glass that can skew readings , and how to avoid them.
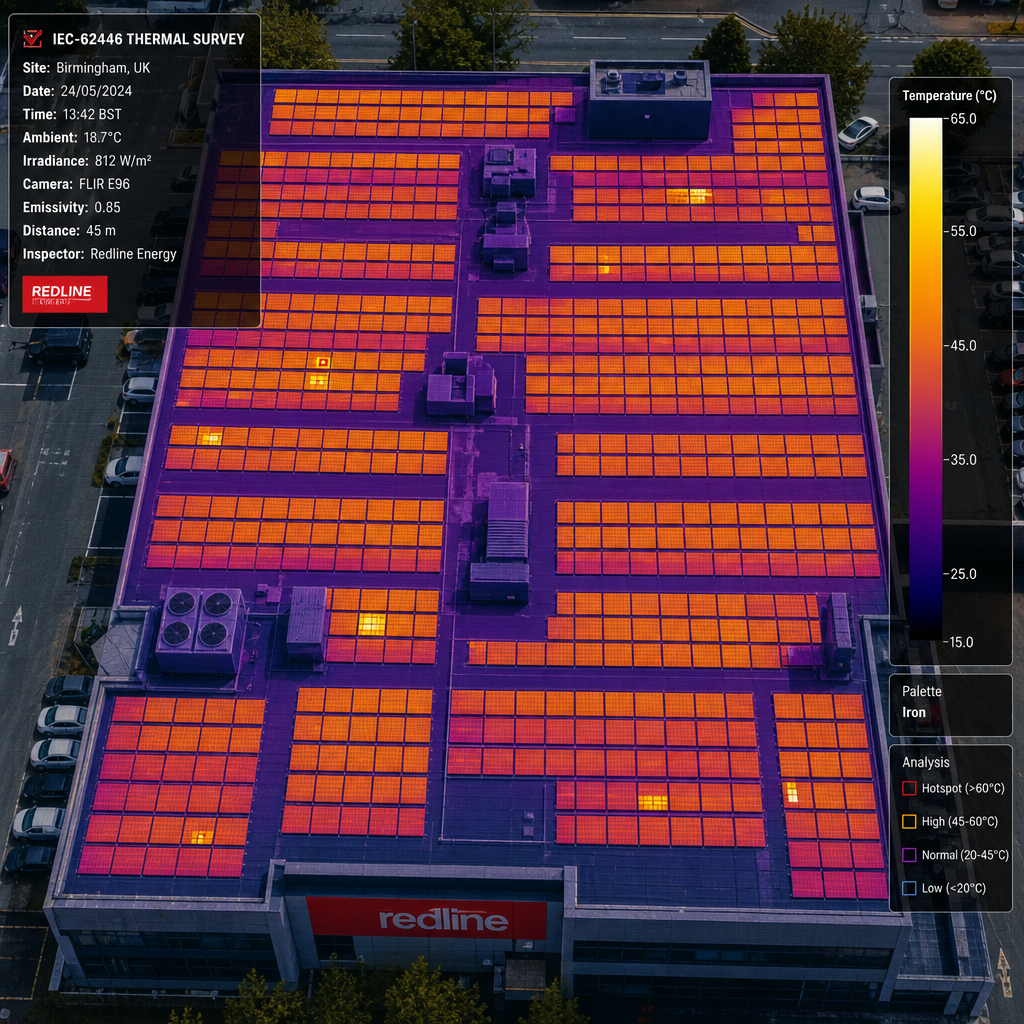
When you pair the thermal map with a 3‑D point cloud of the roof, you get a “what the naked eye can’t see” view that lets engineers pinpoint exact locations of hot‑spots or water‑logged areas. This level of detail reduces the chance of a missed defect slipping through to the next maintenance cycle.
For more on how to integrate thermal data into a compliant IEC 62446 report, see the Building Defect Thermography service page. You’ll be in good hands.
Why Choose Visual Perspectives for Your Heat Loss Survey
When you pick a partner for a heat loss survey, you want three things: speed, accuracy, and compliance. Visual Perspectives delivers all three because it combines drone expertise, certified thermography, and a deep understanding of UK building standards.
First, the company’s drones are CAA‑authorized, meaning every flight meets the civil aviation safety rules that protect your site and staff. Second, the pilots hold ITC Level 1 & 2 qualifications, so they know how to interpret thermal signatures correctly and avoid common errors like emissivity mis‑settings.
Third, the reports are built to IEC 62446 specifications, which is a must‑have for any commercial solar PV project that feeds into the grid. That compliance reduces the paperwork you need to submit to the utility and speeds up the approval process.
Clients also benefit from the integrated service model. Instead of hiring separate firms for roof inspection, 3‑D mapping, and PV thermography, you get a single data package that covers the whole building envelope. This reduces coordination overhead and keeps project timelines tight.
Imagine you’re a facilities manager tasked with a year‑end audit. With Visual Perspectives, you can request a single drone flight that captures roof condition, façade health, and PV performance, all in one go. The resulting report gives you a clear checklist of actions, from sealing a few roof penetrations to re‑stringing a set of underperforming modules.
To see the kind of projects the team has delivered, check out the Drone Roof Survey guide for commercial properties. It walks through real‑world scenarios and shows how the data feeds into maintenance planning.
And if you need to compare costs, the Best Drone Building Survey Services for UK Commercial Roofs page breaks down pricing factors and explains why a complete survey saves money in the long run. Rest assured you’ll be in good hands.
FAQ
What equipment is used in a commercial heat loss survey?
We use a CAA‑approved drone fitted with a calibrated infrared camera, a GPS‑linked 3‑D lidar scanner, and a handheld temperature logger for indoor reference points. The drone flies at a set altitude to keep the camera’s field of view consistent, while the lidar builds a point cloud that the thermal images are draped over. This combo gives you both visual detail and accurate temperature data in one pass.
How often should a commercial building get a heat loss survey?
Most experts recommend an annual survey for large assets, especially if the roof hosts PV panels or if the building has a history of thermal issues. You should also run a survey after major works, such as roof replacement or façade refurbishment, to verify that the new work meets performance targets.
Can a heat loss survey identify water ingress?
Yes. When water is trapped in a roof membrane it retains heat longer than the surrounding dry material. The thermal camera captures that residual heat as a warm spot, even after sunset. By mapping those spots you can pinpoint hidden leaks before they cause structural damage.
What is IEC 62446 compliance and why does it matter?
IEC 62446 is an international standard that defines how PV system testing, documentation, and maintenance should be performed. A compliant heat loss survey means the thermal data is formatted to match the standard, which speeds up utility approvals and ensures the system stays within warranty conditions.
How does a heat loss survey help with decarbonisation goals?
By identifying insulation gaps and air leaks, the survey tells you exactly where to improve the building envelope. Fixing those issues reduces heating demand, which cuts CO₂ emissions. For PV systems, catching hot‑spots improves energy output, further lowering the building’s carbon footprint.
Is a heat loss survey disruptive to building operations?
Not at all. The drone flies above the roof and façade, so there’s no need for scaffolding, rope access, or shutdown of services. The flight typically lasts under an hour, and the data is processed off‑site, meaning occupants can go about their day uninterrupted.
What format does the final report take?
The report is a single PDF that includes a high‑resolution thermal map, a 3‑D point‑cloud view, temperature tables, and an IEC 62446 compliance checklist. All findings are annotated with clear actions, so you can hand the document straight to your project team or asset manager.
How do I know the survey is accurate?
Accuracy comes from calibrated equipment, certified pilots, and software that corrects for emissivity, distance, and ambient temperature. Visual Perspectives also cross‑checks the thermal data with on‑site temperature loggers to verify that the readings match real‑world conditions.
Conclusion
A heat loss survey gives you a window into the invisible energy flows of a commercial building. By using drone thermal imaging you get fast, precise, and detailed data that covers roofs, façades, and solar PV arrays in one go. The compliance built into Visual Perspectives’ workflow, ITC Level 1 & 2, CAA authorisation, and IEC 62446, means you meet regulatory demands without extra paperwork. The result is lower energy bills, reduced carbon impact, and a safer, longer‑lasting asset. If you want to dive dees can fit into your asset‑management strategy, . It walks through budgeting, pricing factors, and ROI calculations tailored for commercial sites. You’ll be in good hands.