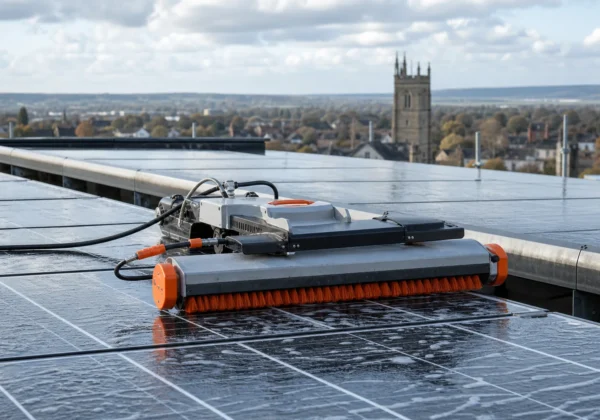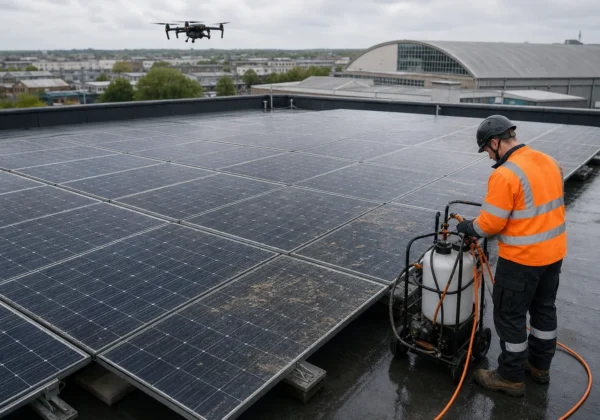
Flat roofs hide water like a secret. A single warm or cold blot on a thermogram can mean a hidden leak, a vent, or just a reflective panel. Below is a usable walk‑through that gets you from planning the scan to delivering a compliant report, with further guidance on thermal imaging for roof leaks available for commercial applications.
Step 1: Plan the flat roof thermal inspection
First, lock in a weather window. The roof should be dry, the sky clear and the outside temperature at least 10 °C (50 °F). A clear night after a sunny day gives the biggest temperature contrast between wet and dry areas. Check the forecast for wind under 5 m/s, strong gusts blur the thermal picture.
Next, write a simple brief. Note the roof size, any known trouble spots, recent repairs, and the client’s goal (e.g., insurance evidence or maintenance planning). This brief becomes the backbone of the final report.
We then set up the drone crew. Our pilots are CAA‑authorised and the thermal payload meets IEC 62446‑3 requirements. The flight plan covers the whole roof with 70 % front overlap and 80 % side overlap, flying at about 10 m altitude. Overlap lets the software stitch a smooth orthomosaic that shows every anomaly in one picture.
Finally, arrange site access. Clear any temporary equipment, mark drainage outlets and note any rooftop plant that could heat the membrane. A clean roof surface prevents debris from creating false hot spots.

By the end of this step you have a weather‑approved schedule, a clear brief, and a safe flight plan ready for launch.
Step 2: Establish the thermal baseline before reading anomalies
When the drone lifts off, capture a reference image of a known dry corner. This spot acts as a temperature baseline for the whole roof. The camera records the exact emissivity (usually 0.95 for roofing membranes) and the ambient temperature.
Thermographers then compare every pixel to that baseline. A difference of just 2 °C can signal moisture, but a 5 °C‑plus rise usually points to significant water retention. The key is consistency, use the same reference throughout the flight.
We also record environmental data: outside air temp, humidity, wind speed and time of day.
Once the baseline is set, the software normalises the whole orthomosaic, highlighting hot and cold spots that deviate from the dry reference. Those deviations become the candidates for further investigation.
By now you should have a colour‑coded map where the warm and cool anomalies stand out against a neutral background.
Step 3: Trace warm and cold patterns across the roof
Open the orthomosaic in the analysis viewer. Zoom into each coloured blob and note its shape, size and location. Warm patches that sit away from drains or HVAC units often indicate wet insulation , water holds heat longer than dry material. Cold (purple) patches can also mean moisture; they appear when evaporative cooling draws heat away, especially on the shaded side of the roof after a rain. A broader thermal imaging roof guide can help when interpreting these patterns across low-slope roof constructions.
Compare the pattern to the roof’s construction drawings. Linear warm streaks may follow membrane seams or flashing. Irregular blobs that break the regular grid usually mark a leak source. If a warm spot aligns with a pipe penetration, that pipe is a prime suspect.
Remember that reflective metal or solar panels can masquerade as warm spots. The camera measures surface temperature, not water directly. A reflective surface throws off the reading, so flag any metallic objects for exclusion.
After you’ve traced every anomaly, tag them with GPS coordinates and a temperature delta (how many degrees they differ from the baseline). This data will feed straight into the verification stage.
By this point you have a clear list of suspect areas, each with a measured temperature gap and a location on the roof plan.
Step 4: Exclude reflective surfaces and other false positives
Before you call anything a leak, cross‑check each hot spot against the roof’s material list. Metal vents, skylights and solar arrays reflect sunlight and can appear hotter than the surrounding membrane. Use the visible‑light orthomosaic to identify these objects and mask them out in the thermal layer.
Next, look for weather‑related artefacts. A recent rain can leave surface water that cools quickly, creating a temporary cold patch that isn’t a leak.
If a spot sits near a roof‑mounted HVAC unit, the unit’s heat output may raise the local temperature. In that case, note the equipment as a possible heat source rather than a defect.
Finally, validate the temperature delta. Small differences (under 2 °C) often fall within sensor noise. Focus on anomalies that exceed the 3‑5 °C threshold recommended by industry guidance. Those are the ones worth sending a moisture meter crew to verify.
At the end of this step you have filtered out the false alarms, leaving a short list of high‑confidence leak candidates.
Step 5: Verify the finding and turn it into an inspection report
Take the GPS‑tagged list to the site. A qualified thermographer uses a calibrated moisture meter on each suspect area. Readings above 20 % moisture in wood or 5 % in plaster confirm water presence. Record the exact meter value, the temperature delta and a close‑up photo of the spot.
Combine the field data with the orthomosaic. In the report we overlay the thermal image on a 3‑D model of the roof, drawing a numbered box around each verified leak. The report follows IEC 62446‑3, showing both infrared evidence and point‑measurement proof.
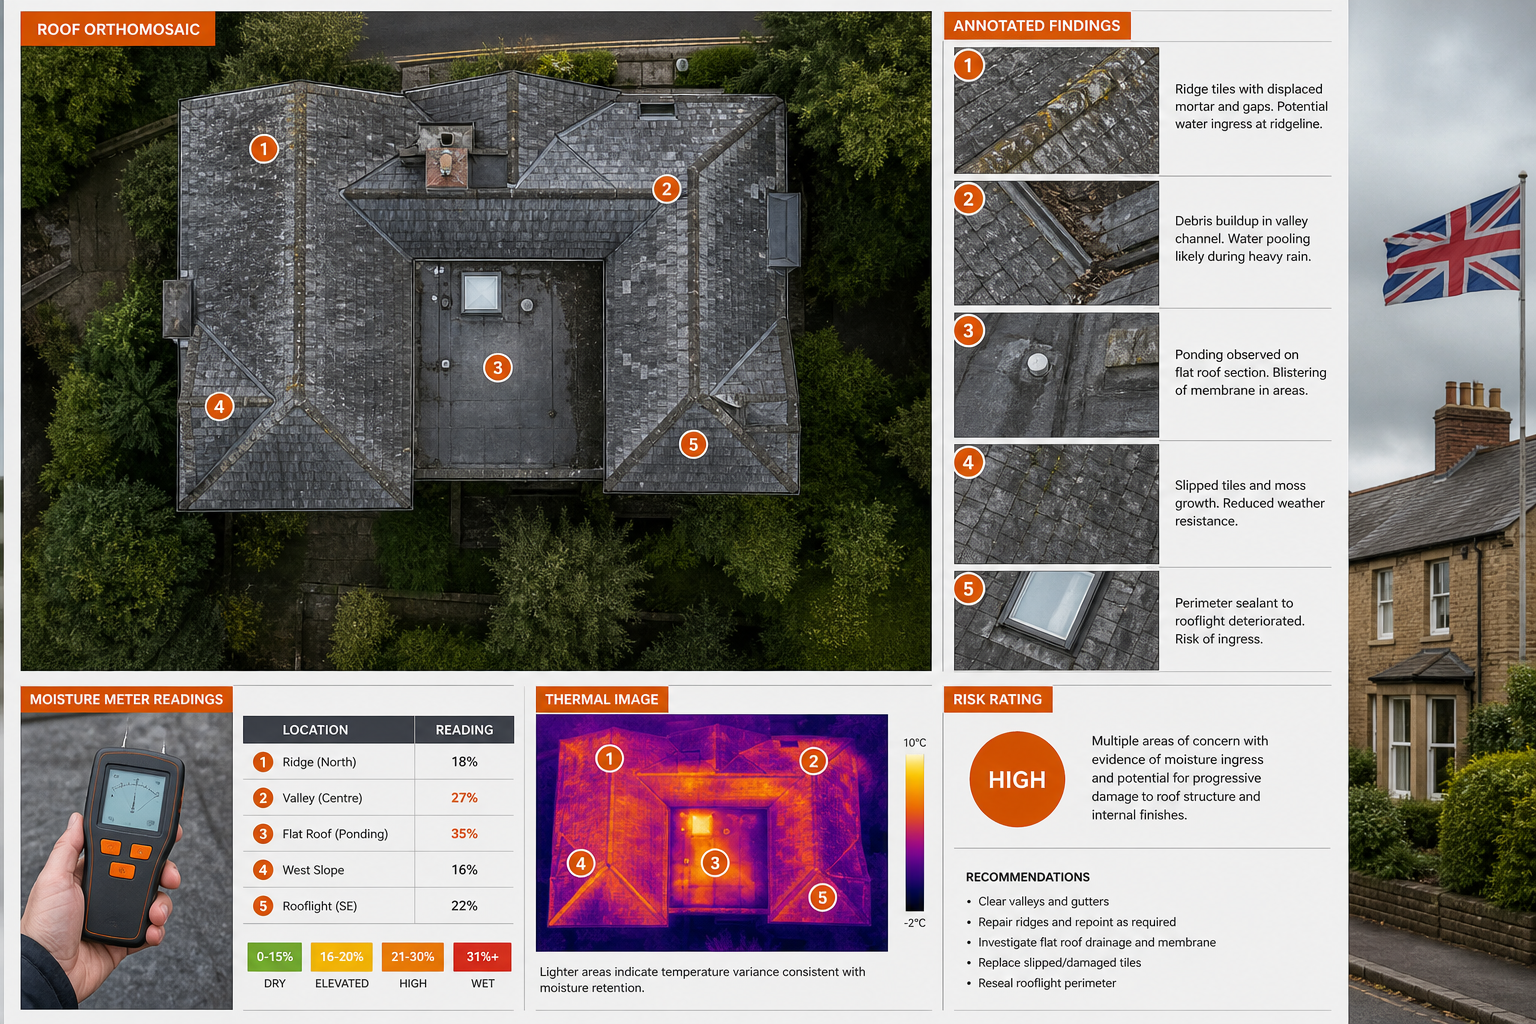
We then add a risk rating, low, medium or high, based on the size of the moisture zone and its proximity to critical services. The report ends with a clear remediation plan: targeted membrane repair, drainage clearing or further invasive testing if the moisture pocket is large.
By now you have a compliant, evidence‑rich report that can be handed to facilities managers, insurers or contractors for decisive action.
Frequently Asked Questions
What does a thermal image actually show on a flat roof?
A thermal image displays surface temperature differences. Warm spots often mean water‑filled insulation that holds heat, while cold spots can indicate evaporative cooling from moisture or a thermal bridge.
Can I rely on a single hot spot to prove a leak?
No. A hot spot alone is just a clue. You need to confirm it with a moisture meter or another point‑test before calling it a leak.
What time of day gives the best results?
Just after sunset works best for flat roofs. The roof cools quickly, but wet insulation stays warm, creating a clear contrast.
Do reflective surfaces ever give false readings?
Yes. Metal vents, skylights and solar panels can appear hotter than the surrounding membrane. Mask them out in the thermal layer before you draw conclusions.
How accurate does the temperature difference need to be?
Industry guidance suggests a delta of at least 3 °C to flag a potential moisture problem. Larger differentials (5 °C‑8 °C) usually indicate more serious water ingress.
Conclusion
For reliable flat‑roof leak detection, start with a weather‑approved plan, set a solid thermal baseline, trace and filter the patterns, then verify with point measurements. Our own drone‑based service at Visual Perspectives Limited follows this exact workflow and delivers IEC 62446‑compliant reports that stand up to audit. Get in touch to schedule a compliant scan and turn hidden moisture into actionable data.