A solar panel inspection report can run to 30 pages of thermal images, temperature data, and defect codes. If you don’t know what you’re looking at, critical faults get missed and risk ratings go unread. This guide walks you through each section of a commercial PV inspection report, so you can act on the findings with confidence.
Step 1: Understand What a Solar Panel Inspection Report Should Contain
Before you interpret any data, check that the report is complete. A well-formed solar panel inspection report for a commercial rooftop array should follow a defined structure. If sections are missing, the report may not satisfy insurers, warranty providers, or asset management teams.
At a minimum, expect these sections:
- An executive summary with the site address, inspection date, array size, and overall condition rating
- Environmental conditions at the time of survey (solar irradiance level, wind speed, ambient temperature)
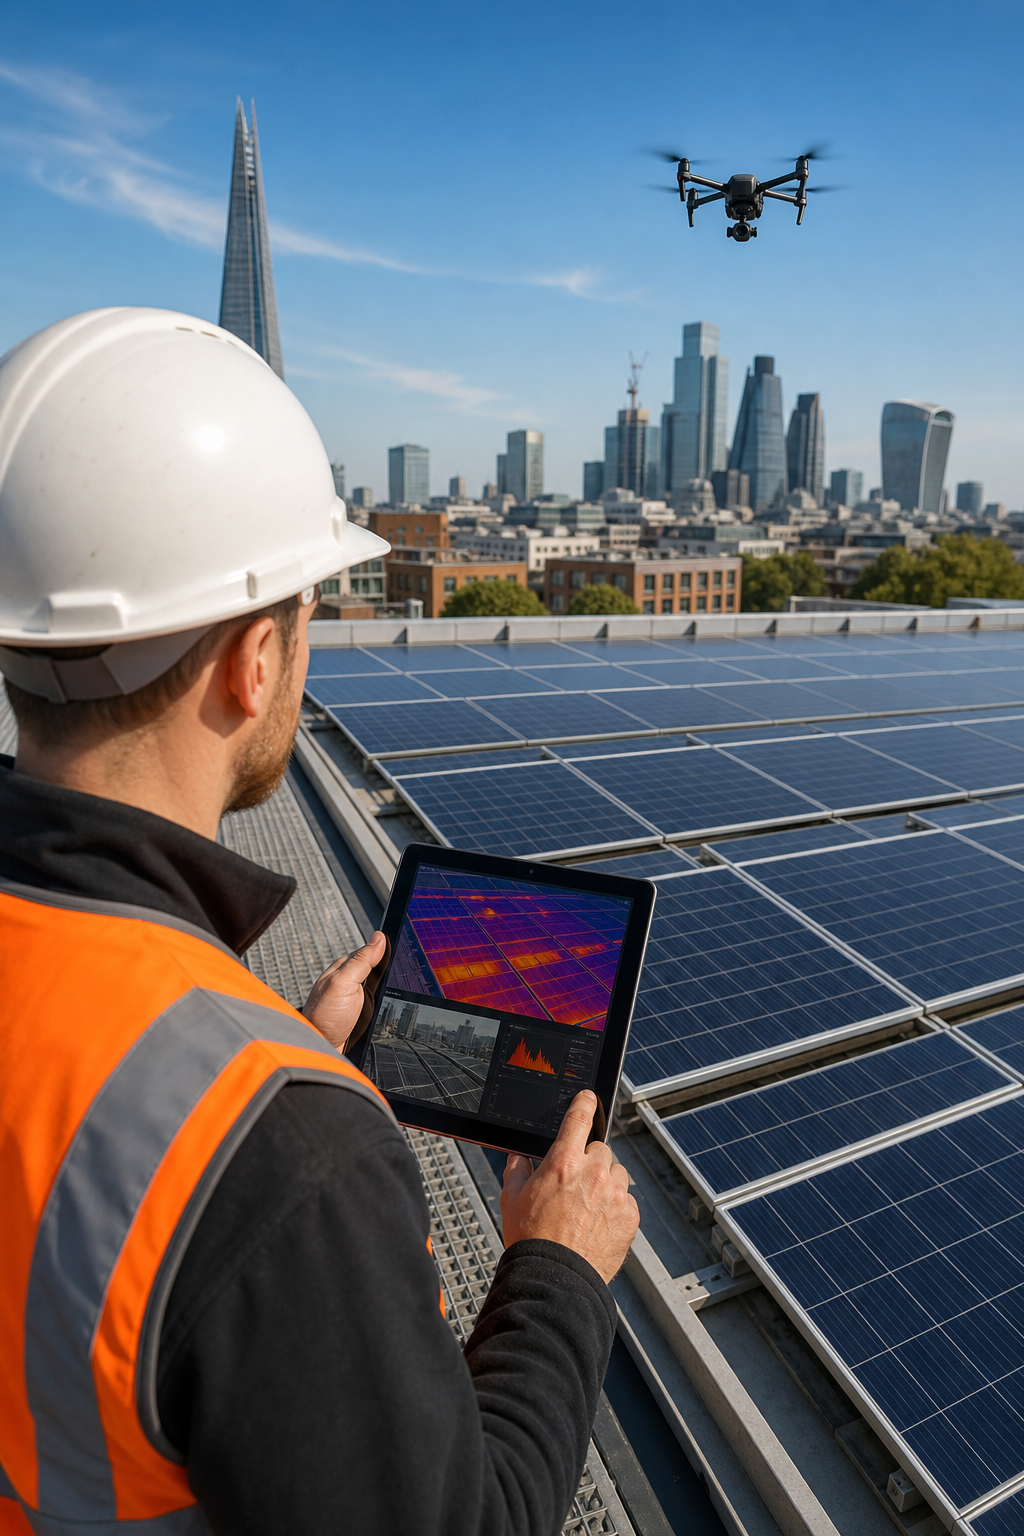
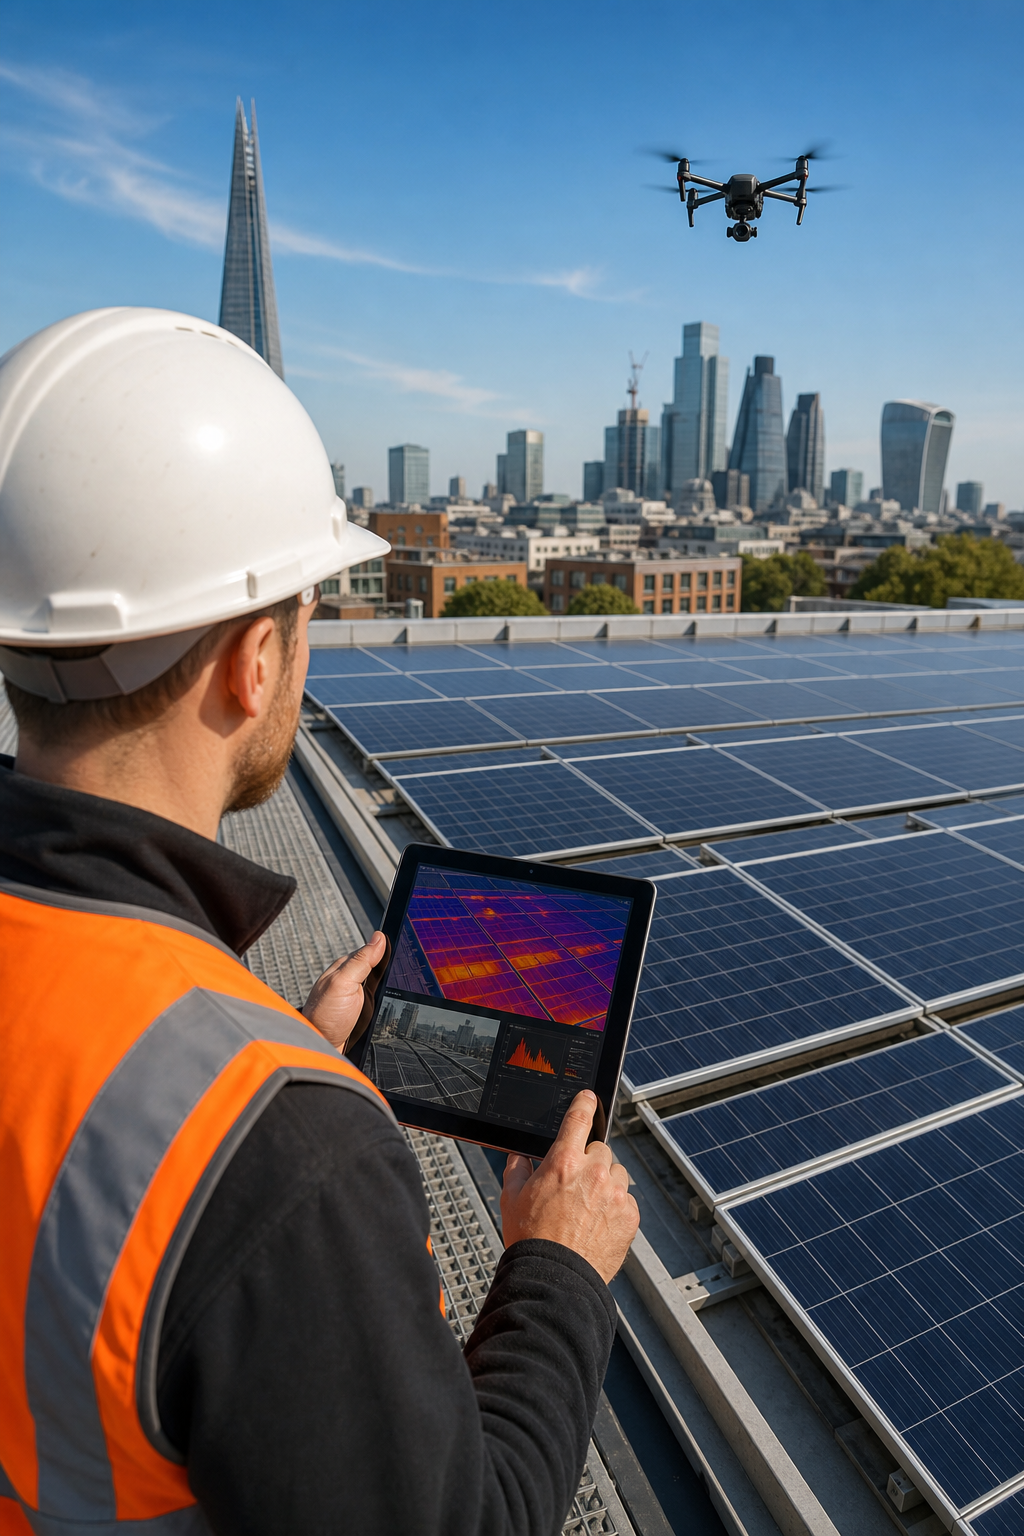
- Survey methodology (drone-based thermography, handheld camera, or both)
- A fault map with GPS-tagged defect locations overlaid on an aerial or schematic plan of the array
- Thermal and RGB images of each identified anomaly
- A defect log with severity classifications and recommended actions
- A compliance statement confirming which standard the inspection followed
If the report you’ve received skips the environmental conditions section, that’s a problem. IEC 62446, the international standard governing the testing, documentation, and maintenance of grid-connected photovoltaic systems, requires that irradiance and temperature data be recorded alongside any thermal findings. Without those numbers, you can’t verify whether the survey was conducted under conditions valid for defect detection.
At Visual Perspectives Limited, every report we produce follows the IEC 62446 layout and includes an executive summary, a geotagged fault map, environmental data, and a prioritised action list. As part of our commercial solar panel inspection process, the report is delivered as both a PDF and an online viewer within 48 hours of the survey.
Once you’ve confirmed the report is complete, you’re ready to interpret what it says.
Step 2: Check IEC 62446 Compliance in the Report
IEC 62446 is the benchmark that insurers, warranty holders, and facilities managers rely on. A report that doesn’t state compliance with this standard may not be accepted for insurance purposes, warranty claims, or regulatory submissions.
Here’s what to look for in the compliance section of the report:
- Irradiance threshold: The survey must have been conducted at 600 W/m² or above. If the irradiance value in the report is lower than this, the thermal contrast between a healthy cell and a faulty one may not be sufficient for accurate diagnosis.
- Wind speed: IEC 62446 sets an upper limit of 5 m/s during the survey. High wind cools modules unevenly, which masks hotspots and produces false negatives.
- Camera specification: The thermal camera must have a resolution of at least 640×480 pixels and a thermal sensitivity (NETD) of 0.1°C or better.
- Emissivity setting: The report should confirm the camera was set to an emissivity of 0.95, the correct value for glass-covered PV cells.
- Compliance certificate: A clear statement that the inspection was performed in accordance with IEC 62446 should appear on the cover page or in the methodology section.
If any of these elements are absent, contact the inspection provider before relying on the report for any insurance or compliance purpose. A missing emissivity value or an irradiance figure below threshold doesn’t automatically make the data wrong, but it does mean the report won’t stand up to scrutiny from a loss adjuster or warranty team.
Once you’ve confirmed the compliance parameters are met, the thermal findings become meaningful. That’s where the real diagnostic work starts.
Step 3: Interpret Thermal Imaging Results and Defect Classifications
The thermal imaging section is the core of any PV inspection report. It shows which modules are running hotter than their neighbours and by how much. The temperature differential (often written as ΔT) is the number that drives the severity classification.
Most IEC 62446-aligned reports classify defects into three bands based on ΔT:
- Minor / low severity:ΔT below 10°C above the reference module. Often caused by soiling, minor shading, or a single cell crack. Monitor and clean; no urgent repair needed.
- Moderate / medium severity:ΔT between 10°C and 30°C. Likely causes include bypass diode failure, partial cell degradation, or string-level wiring faults. Schedule repair within the maintenance cycle.
- Critical / high severity:ΔT above 30°C. These are the hotspots that present a genuine fire risk. A module running 40°C or more above its neighbours can ignite adjacent materials, particularly on flat commercial roofs where membrane or insulation sits directly beneath the array. These require immediate action.
Beyond hotspots, a thorough report should flag these specific fault types:
- PID (potential-induced degradation): Appears as a pattern of improved temperature across a block of cells, not just one spot. PID reduces output progressively and can be hard to reverse.
- Bypass diode failure: One-third of a module appears significantly hotter than the rest. The diode has activated to protect the string, but the underlying cell problem remains.
- String outage: An entire row of modules shows no thermal activity. The string is offline, and output for that section is zero.
- Cell cracks: Fine thermal lines across a cell face. Common after hail or mechanical stress during installation.
Each fault entry in the defect log should include a panel ID or GPS coordinate, the ΔT value, the fault type, and the recommended action. If the report just shows a red thermal image without identifying the panel or quantifying the temperature difference, it lacks the data you need to act on it.
You can read more about the different thermal imaging methods used during commercial PV surveys in our guide on solar panel thermal inspection methods for commercial buildings.
Step 4: Assess Roof Condition Findings Before and After Installation
Many inspection reports focus solely on the panels. A complete commercial report should also document the condition of the roof surface beneath and around the array. This matters for two reasons. First, a defective roof membrane can void a PV warranty. Second, hidden moisture saturation under insulation is a fire risk that thermal imaging can detect independently of any panel fault.
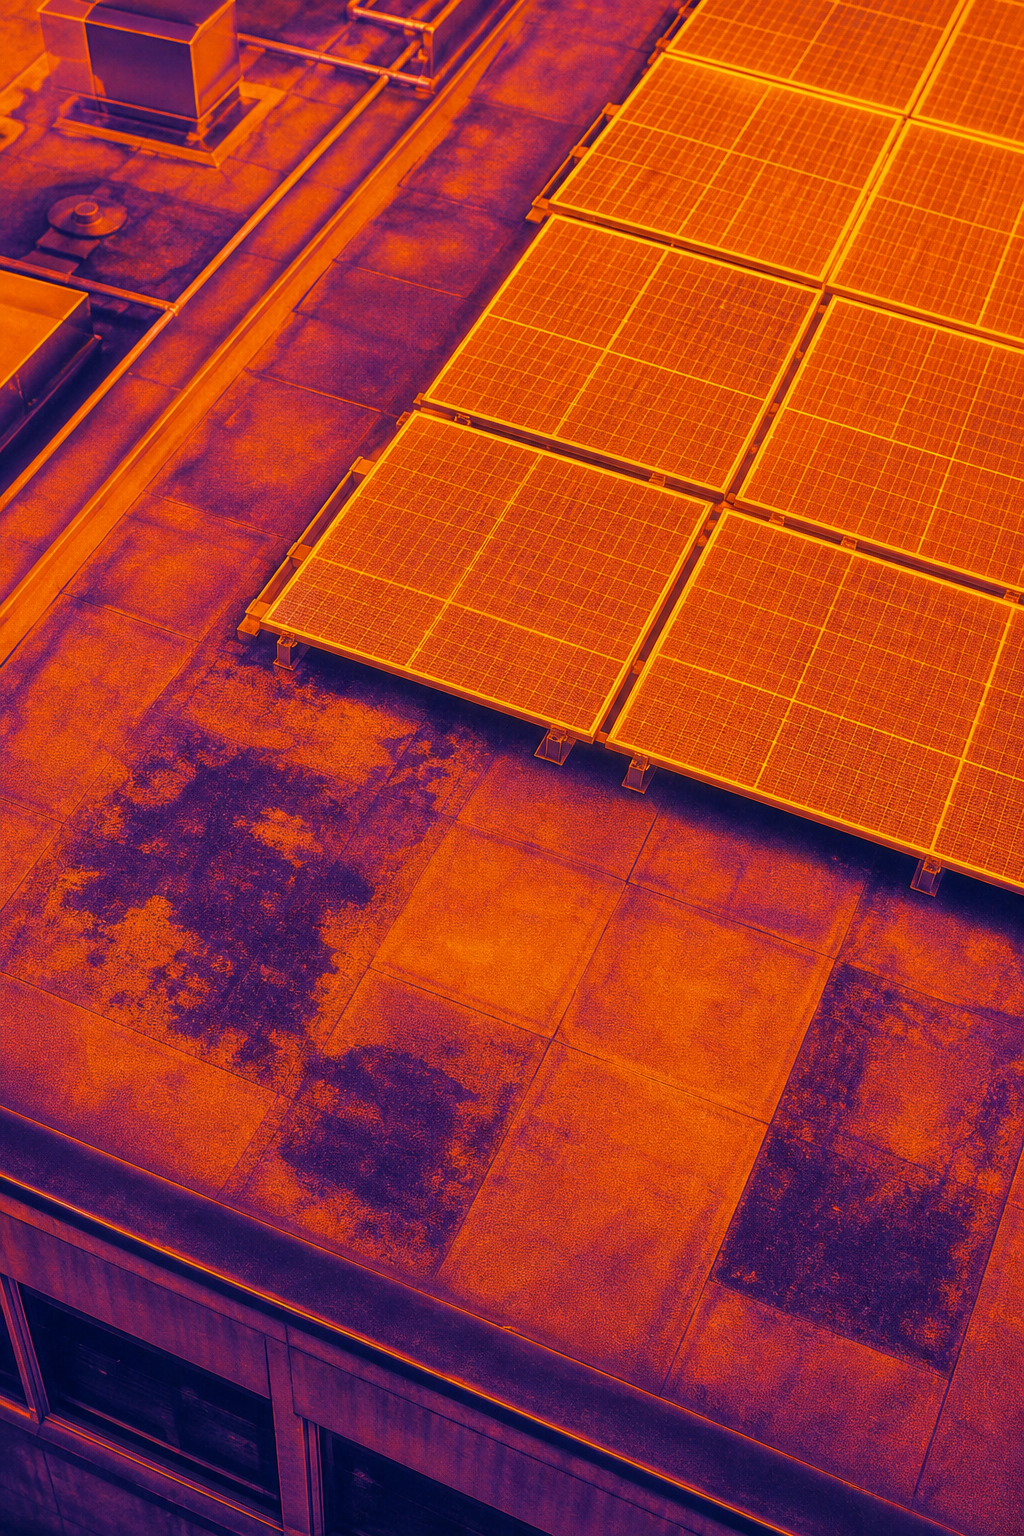
Pre-installation roof surveys are increasingly part of the inspection workflow on commercial projects. The logic is straightforward: if a roof has saturated insulation or membrane failures before the array goes down, those defects will worsen under the panels and become expensive to fix later. They also create conditions where electrical faults in the PV system interact badly with wet substrates, increasing fire and electrical risk.
When reading the roof condition section of a report, look for:
- Thermal evidence of membrane saturation (cold wet patches that show as cooler areas in thermal imaging, particularly after rain)
- Structural deflection or ponding zones noted in the visual survey
- Penetration points where mounting brackets have been fixed through the membrane, with any signs of water ingress around fixings
- Condition ratings for edge details, upstands, and drainage channels that serve the roof area under the array
A post-installation inspection report should compare current roof condition against any pre-installation baseline survey. If no baseline exists, the inspector should note this gap, because it limits the ability to attribute defects to the installation process or to pre-existing conditions.
For asset managers and facilities teams managing commercial portfolios, this baseline-versus-current comparison is often the most valuable section of the entire document. It protects against disputes with installers and supports accurate budgeting for future remediation works.
Step 5: Evaluate Risk Ratings and Recommended Actions
Once you’ve worked through the thermal findings and the roof condition section, the risk matrix pulls everything together. This is the section that tells you, in plain terms, what needs to happen next.
A well-structured risk matrix in a commercial PV inspection report typically looks like this:
Read the recommended actions column carefully. Vague language like “monitor for changes” without a timeframe is not useful. A good report gives a specific action and a specific window. If the report you’re reviewing doesn’t provide that, push back on the inspection provider for clarification before filing it.
Also check whether the recommended actions distinguish between electrical remediation and physical roof repairs. The two often involve different contractors, and conflating them creates delays. A report that separates roofing referrals from PV component replacements is easier to act on across your facilities team.
Step 6: Use the Report for Insurance and Compliance Purposes
A solar panel inspection report produced to IEC 62446 has real currency with insurers, loss adjusters, and warranty providers. But only if you use it correctly.
For insurance purposes, the report demonstrates that you’ve fulfilled a duty of care. It shows that the PV system on your commercial building has been inspected, that faults have been identified and classified, and that recommended actions are on record. If a fire or electrical incident occurs and you can produce a dated, IEC-compliant inspection report, it materially strengthens your position with the insurer.
Conversely, if you receive a report that flags critical hotspots and take no documented action, that pa only protects you if you act on it and record what you did.
For warranty compliance, a solar panel warranty inspection following IEC 62446 is typically the format that module manufacturers and installation warranty holders require. The thermal orthomosaic, the defect log with GPS coordinates, and the compliance certificate together form the package that warranty teams need to process a claim without requesting additional evidence.
If your organisation is subject to ESG reporting, net-zero targets, or public sector energy compliance requirements, retain the report as part of your asset condition record. Thermal inspection data supports decarbonisation planning by identifying underperforming strings that are suppressing actual yield versus predicted yield.
Visual Perspectives Limited provides IEC 62446-compliant reports accepted by insurers, warranty providers, and O&M teams across the UK. Our reports include a compliance certificate, a thermal orthomosaic, GPS-tagged defect entries, and a signed methodology statement. You’ll have everything you need to satisfy a loss adjuster or warranty claim without going back to us for supplementary data.
FAQ
What is a solar panel inspection report used for?
A solar panel inspection report documents the condition of a commercial PV array at a specific point in time. It’s used to identify electrical faults, assess fire risk from hotspots, satisfy insurance requirements, support warranty claims, and inform O&M scheduling. For commercial buildings, IEC 62446-compliant reports are the accepted format for insurers and warranty providers.
How often should a commercial PV system be inspected?
Most commercial PV operators commission a thermal inspection annually. High-value arrays, systems on NHS, local authority, or education estate buildings, or any array that has previously shown hotspot faults should be inspected more frequently. Many warranty conditions require at least one IEC 62446-compliant thermal survey per year to keep the warranty valid.
What does a ΔT value mean in a thermal inspection report?
ΔT is the temperature difference between a suspect module and a reference module operating under the same conditions. A ΔT above 30°C indicates a critical fault with potential fire risk, requiring immediate action. A ΔT between 10°C and 30°C indicates a significant fault to repair within 30 days. Below 10°C is low severity and typically monitored at the next scheduled inspection.
Does a solar panel inspection report need to follow IEC 62446?
For commercial buildings, yes. IEC 62446 is the international standard that defines survey methodology, environmental conditions, camera specifications, and reporting requirements for grid-connected PV systems. Insurers and warranty providers in the UK routinely require this standard. A report that doesn’t state IEC 62446 compliance may be rejected for insurance or warranty purposes.
Can a drone inspection report be used as evidence for an insurance claim?
Yes. A drone-based thermographic inspection report that follows IEC 62446 is accepted by most UK commercial property insurers and loss adjusters. It needs to include GPS-tagged fault locations, thermal and RGB images, a defect log with severity ratings, environmental conditions at the time of survey, and a compliance statement. Visual Perspectives Limited produces reports in exactly this format.
What should I do if my inspection report flags a critical hotspot?
Isolate the affected string or module as soon as safely possible and contact a qualified PV engineer. Do not delay while awaiting a maintenance schedule. Document the date you received the report and the date you acted. This record matters for insurance purposes. If the report was produced by Visual Perspectives Limited, the defect entry will include the panel GPS coordinate and a specific recommended action to pass directly to your contractor.
Conclusion
Reading a commercial PV inspection report well means checking it’s complete, confirming IEC compliance, understanding what the ΔT values actually tell you, and then acting on the risk ratings within the stated timeframes. A report that sits in a folder un produced correctly from the start, with thermal imaging, GPS-tagged defects, and IEC 62446 certification, get in touch with Visual Perspectives Limited or explore our guide to commercial solar panel inspection services across the UK.